Figure 5.
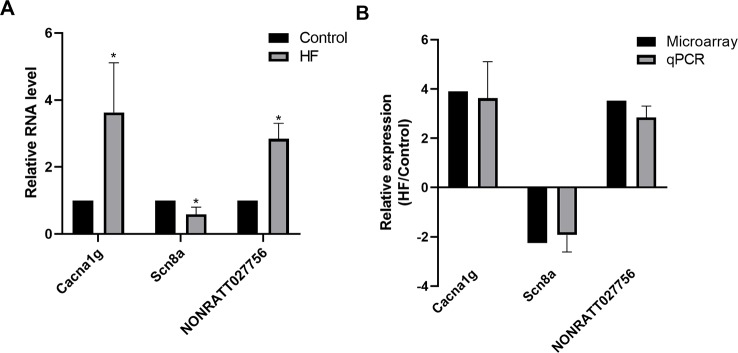
Quantitative PCR (qPCR) validation. (A) Relative expression levels of selected messenger RNAs (mRNAs) (Cacna1g, Scn8a) and long non-coding RNA (lncRNA) (NONRATT027756) in heart failure (HF) rat hearts (n = 3) compared with controls (n = 3). (B) Comparison between microarray and qPCR results of selected differentially expressed mRNAs (Cacna1g, Scn8a) and lncRNA (NONRATT027756). The qPCR analysis results were consistent with the microarray data. All reactions were repeated three times for each mRNA or lncRNA. Actin was used as internal control. *P < 0.05 HF vs. control.

