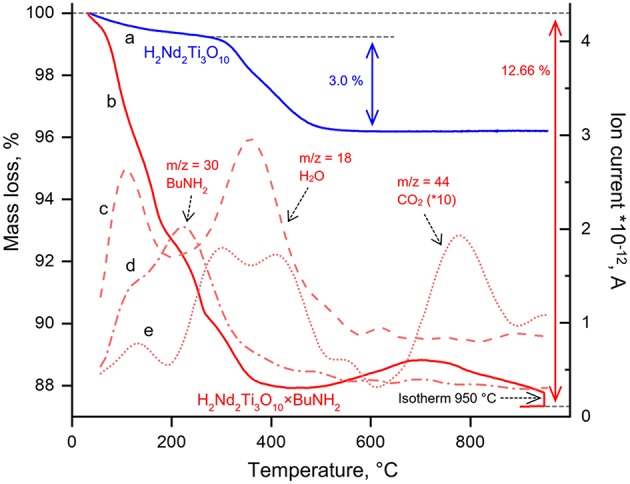
Figure 5.

Thermogravimetric curves for H2Nd2Ti3O10 (a), H2Nd2Ti3O10×BuNH2 (b) and ion currents recorded during simultaneous thermal analysis coupled with mass spectrometry at m/z = 18 (c), m/z = 30 (d), m/z = 44 (e).

Thermogravimetric curves for H2Nd2Ti3O10 (a), H2Nd2Ti3O10×BuNH2 (b) and ion currents recorded during simultaneous thermal analysis coupled with mass spectrometry at m/z = 18 (c), m/z = 30 (d), m/z = 44 (e).