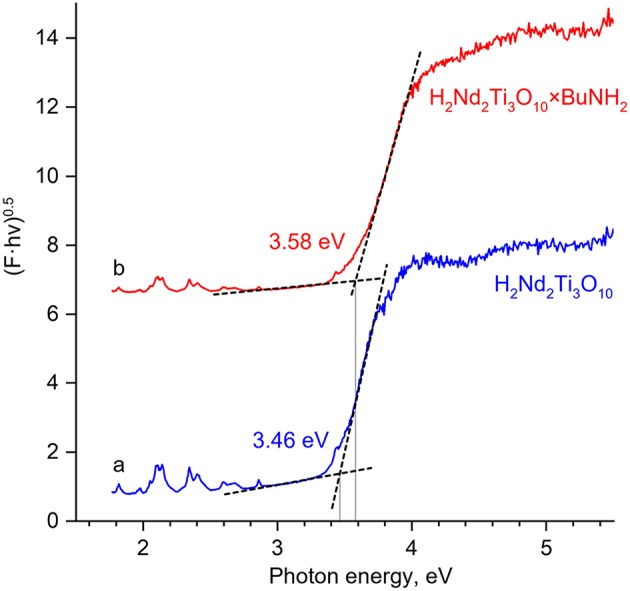
Figure 7.

The Tauc plots for H2Nd2Ti3O10 (a) and H2Nd2Ti3O10×BuNH2 (b) based on diffuse reflectance measurements. The Kubelka-Munk function F is plot against the photon energy hν in the coordinates (F·hν)0.5 – hν. The bandgap energy is determined from the cross point of linear sections.
