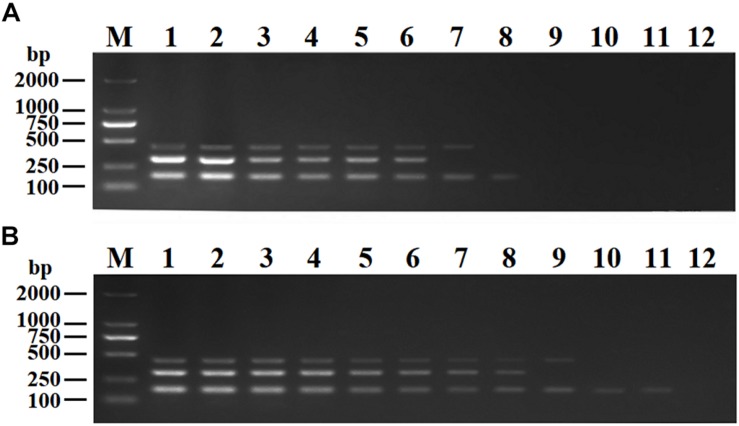
FIGURE 6.
Sensitivity of conventional PCR (A) and DPO-nanoPCR (B). A serial 10-fold diluted plasmid mixture was used. Lane M, DL2000 DNA marker; Lane 1–11, pMD19-T-VP6 concentrations ranging from 9.40 × 10¹⁰copies/μL to 9.40 × 100 copies/μL, pMD19-T-VP2 concentrations ranging from 5.14 × 10¹⁰ copies/μL to 5.14 × 100 copies/μL, and pMD19-T-5′UTR concentrations ranging from 4.09 × 10¹¹ to 4.09 × 101 copies/μL; Lane 12, negative control.

