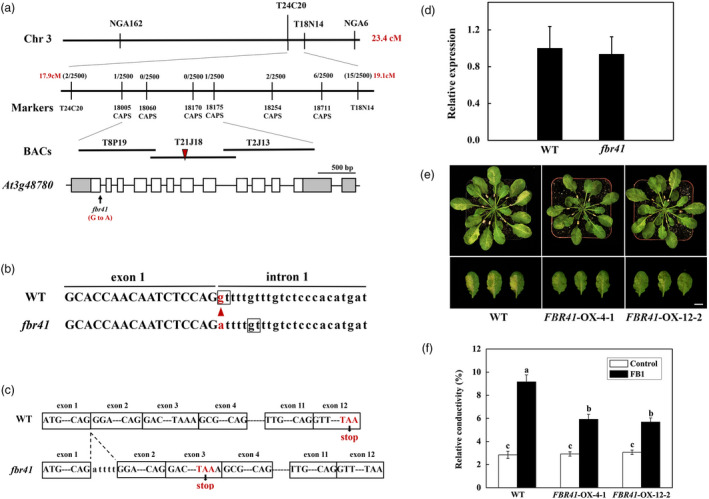
Figure 2.

Map‐based cloning of FBR41. (a) Map‐based cloning of FBR41 locus. An arrowhead indicates a G‐to‐A substitution in At3g48780 locus in fbr41. Grey boxes and white boxes indicate UTR and exons, respectively, and line segments represent introns. BACs, bacterial artificial chromosomes. (b) Genomic DNA sequence of At3g48780 in wild type (WT) and fbr41. The triangle shows the mutation in the splicing junction of the exon 1 and the intron 1 in At3g48780. The nucleotides in boxes indicate the 5′ splice donor sites. (c) A five base‐pair insertion (ATTTT) between exon 1 and exon 2, and a premature stop codon at exon 3 in the At3g48780 transcripts in fbr41. (d) Quantitative RT‐PCR analysis of the At3g48780 transcripts in WT and fbr41. (e) Phenotypes of FBR41‐overexpressing plants upon FB1 treatment. Photographs were taken at 3 days postinjection (DPI). Scale bar = 1 cm. (f) Quantitative measurements of relative conductivity in treated leaves at 3 DPI. Six representative leaves from three plants were collected and pooled as one sample. Data shown are means ± SD of three biological replicates. Different letters denote a statistically significant difference from control‐infiltrated WT (one‐way ANOVA, P < 0.05, Tukey's test).
