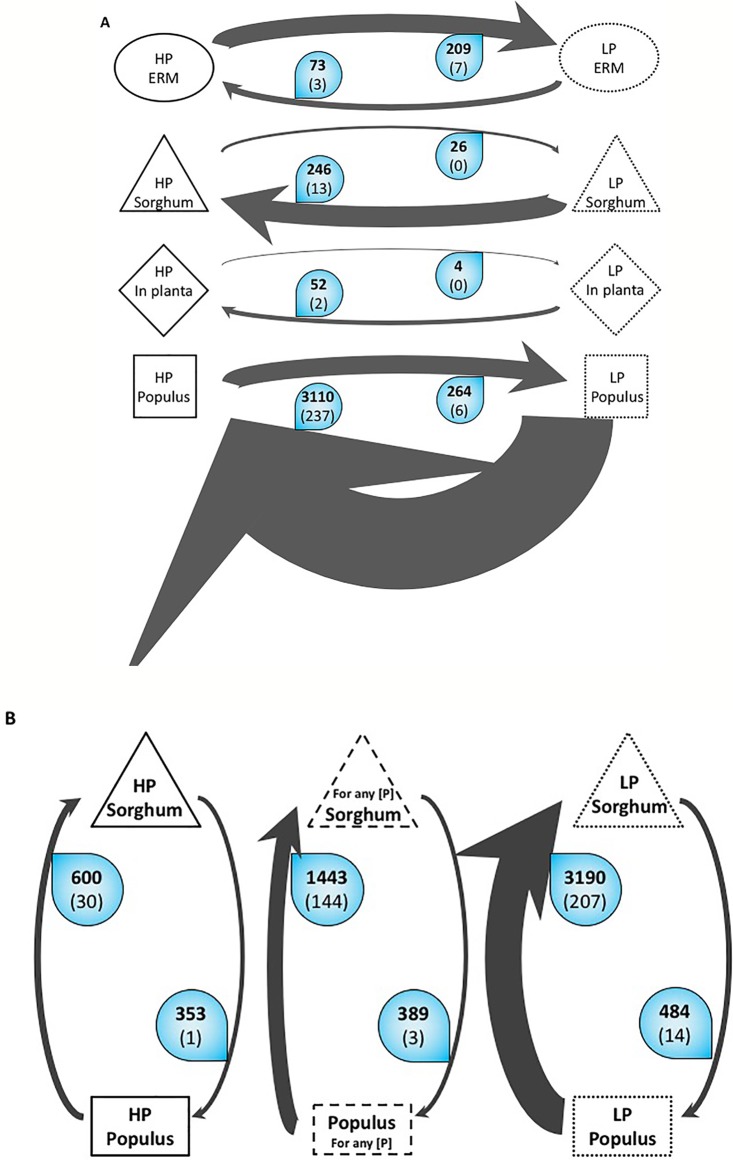
Figure 1.
Overall variations of the number of Differentially Expressed Genes (DEG) of R. irregularis (A) Variations according to P. The arrows represent the number of differentially expressed genes in R. irregularis. Black bold numbers represent the number of genes with a fold change ≥2 and a false discovery rate ≤ 0.05. White numbers in brackets represent the number of genes involved in the transportome. The width of the arrow is proportional to the number of up-regulated genes. For example, the top arrow means that in the ERM grown in Low Phosphate, 209 genes are significantly up regulated at least two times compared to the ERM grown in High Phosphate. Among these 209 genes, seven are involved in the transportome. (B). Variations according to host plant. The arrows represent number of differentially expressed genes in R. irregularis between the two compared conditions. Black bold numbers represent the number of genes with a fold change ≥2 and a false discovery rate ≤ 0.05. White numbers in brackets represent the number of genes involved in the transportome. The width of the arrow is proportional to the number of up-regulated genes. ERM, extraradical mycelium; HP, high phosphate; LP, low phosphate; in planta, intraradical mycelium of both sorghum and poplar.

