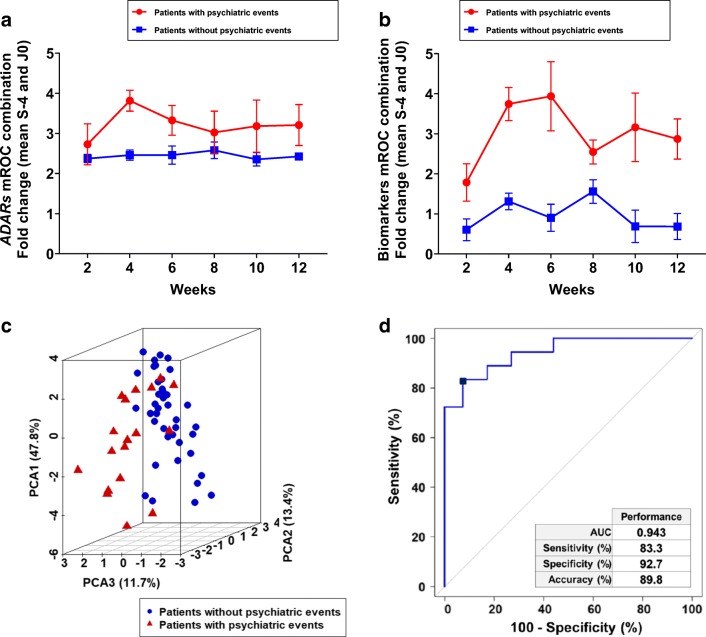
Fig. 4.
Diagnostic performances of a combination of biomarkers. a Longitudinal analysis of an mROC combination of biomarkers composed of ADAR gene expression in the group of patients that showed clinical depression (n = 3) and the group that did not show clinical depression (n = 7). b Longitudinal analysis of an mROC combination of ADAR gene expression and RNA editing biomarkers in the group of patients that showed clinical depression (n = 3) and the group that did not show clinical depression (n = 7). c Principal component analysis of ADARs, PDE8A gene expression and PDE8A mRNA editing sites in the group of patients that showed clinical depression (n = 3) and the group that did not show clinical depression (n = 7). The scatter plot visualises the first, second and third principal components and respective variance percentages on the x-, y- and z-axis of ratio (fold change) of biomarkers before and after treatment in longitudinal analysis. Red triangle: patients with psychiatric events. Blue circle: patients without psychiatric events. d ROC curve of a combination of biomarkers to separate the population with and without psychiatric disorders (depression). Diagnostic performances of the algorithm are indicated

