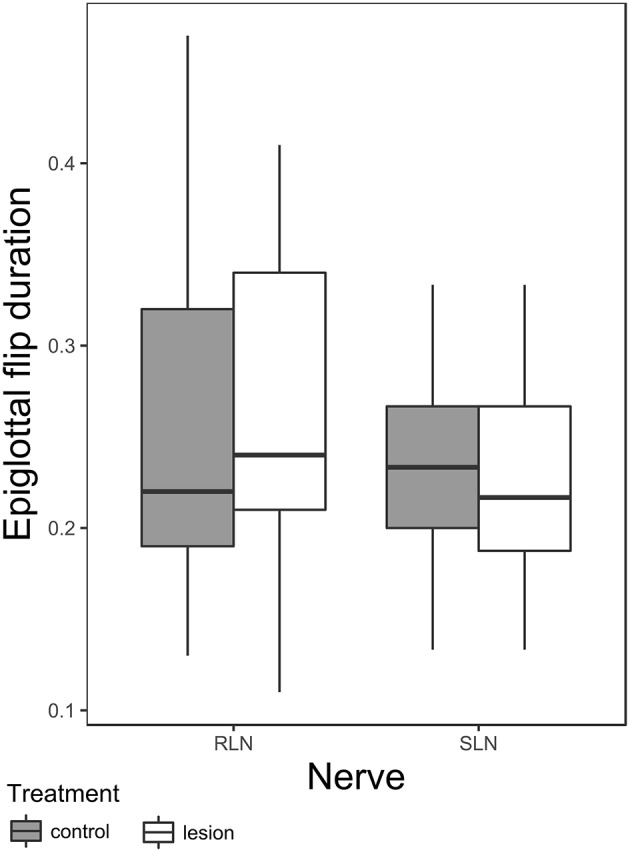
Figure 3.

Box plot of duration of epiglottal flip in RLN and SLN lesioned animals. The box represents 50% of the data, with the line near the middle representing the median. Whiskers extend to 1.5 times the interquartile range from the median. Dots are outliers.
