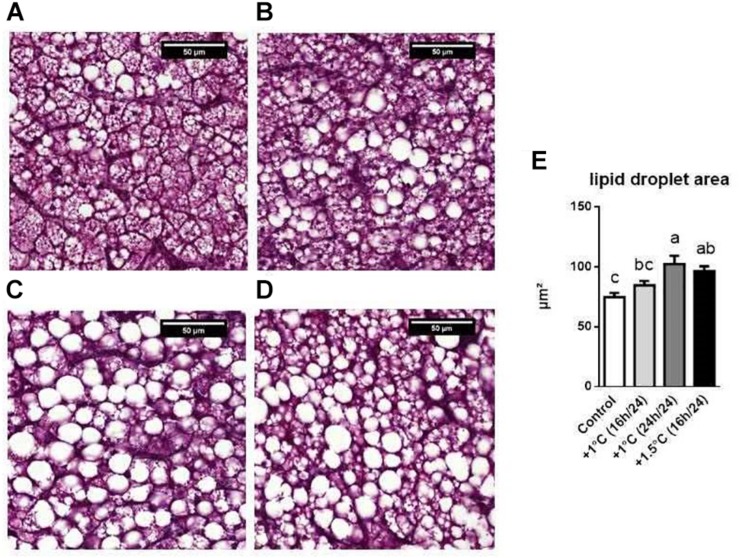
FIGURE 4.
Histological analysis. (A–D) Representative images of lipid droplet in the liver of the different groups: control (A), +1°C 16 h/24 h (B), +1°C 24 h/24 h (C) and +1.5°C 16 h/24 h (D). Scale bars: 50 μm. (E) Mean of lipid droplet area above 48 μm2 of male mule ducks post-OF (n = 14, the analysis was done on two different images of each sample for a total of seven samples per group). Data are presented ± SEM. One-way ANOVA (followed by Tuckey’s multiple comparison test) was performed. Values without common letters were statistically different (P < 0.05).

