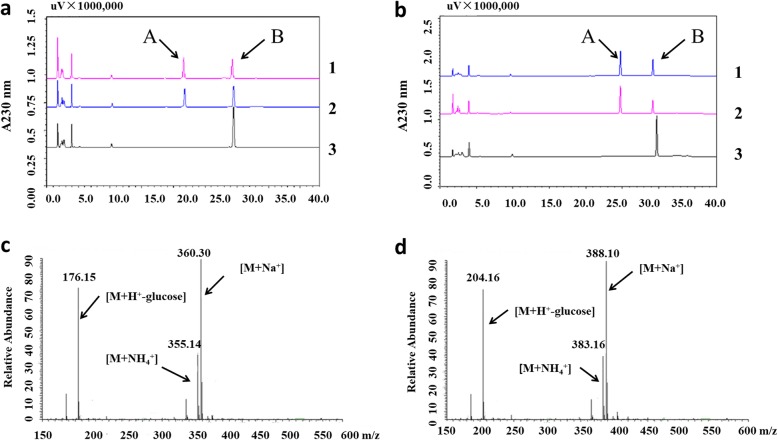
Fig. 3.
HPLC and LC-MS analysis of reaction products from IAA and IBA catalyzed by OsIAGT1. a and b HPLC analysis of reaction products from IAA and IBA, respectively. 1, 2, 3 denote the reactions with recombinant protein OsIAGT1, UGT74D1 (positive control), GST (negative control), respectively. “A” denotes the possible products; “B” denotes the substrate IAA or IBA. c and d LC–MS analysis of reaction products from IAA and IBA, respectively

