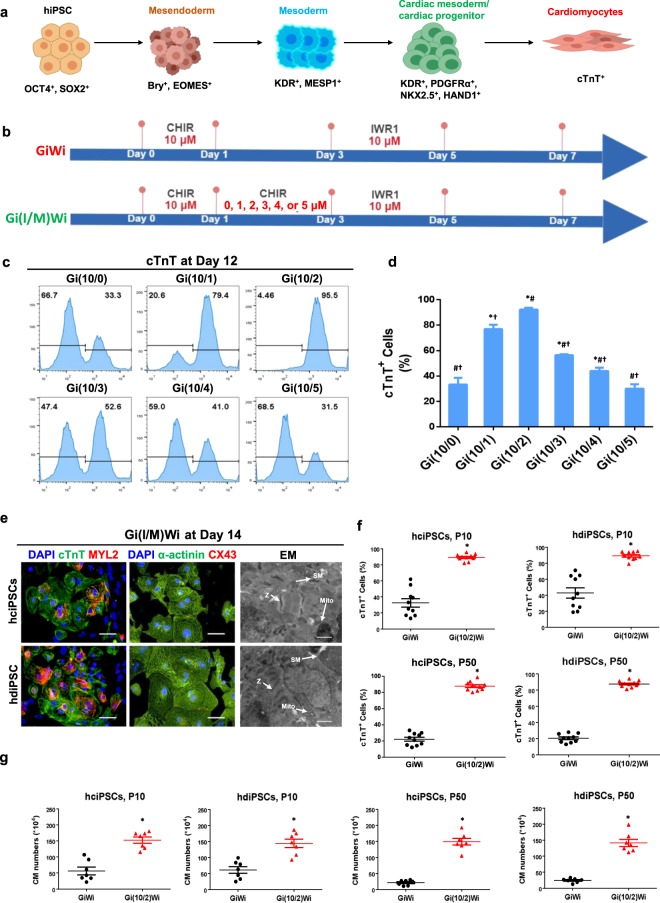
Figure 1.
The Gi(I/M)Wi hiPSC-CM differentiation protocol is highly efficient for hiPSCs of different origins and passages. (a) The differentiation of hiPSCs into CMs progresses through stages of mesendoderm, mesoderm, and cardiac mesoderm/CPC specification, and each stage is associated with the expression of specific sets of genetic markers. (b) The GiWi and Gi(I/M)Wi protocols are illustrated schematically, including the time points and concentrations of CHIR and IWR1 treatment. In the Gi(I/M)Wi protocol, the cells were differentiated with the following initial (I) and maintenance (M) CHIR doses: Gi(10/0), I = 10 μM and M = 0 μM; Gi(10/1), I = 10 μM and M = 1 μM; Gi(10/2), I = 10 μM and M = 2 μM; Gi(10/3), I = 10 μM and M = 3 μM; Gi(10/4), I = 10 μM and M = 4 μM; Gi(10/5), I = 10 μM and M = 5 μM. (c) Twelve days after differentiation was initiated, expression of the CM marker cTnT was evaluated in cells from all six Gi(I/M)Wi treatment groups via flow cytometry; then, (d) the proportion of cells that expressed cTnT was calculated and presented as a percentage of the total number of cells (n = 3 different batches of differentiated cells). *P < 0.05 vs. Gi(10/0); #P < 0.05 vs. Gi(10/1); †P < 0.05 vs. Gi(10/2).(e) hiPSCs reprogrammed from cardiac (hciPSCs) or dermal (hdiPSCs) fibroblasts were differentiated via the Gi(I/M)Wi protocol with CHIR initiation and maintenance doses of 10 μM and 2 μM respectively. Fourteen days after differentiation was initiated, the cells were immunofluorescently stained and imaged for the expression of cTnT, MYL2, α-actinin, and Cx43 (bars = 50 μm) and also verified by transmission electron microscopy (SM: sarcomere, Z: Z-band, Mito: mitochondrion; bars = 2 μm). (f,g) hciPSCs and hdiPSCs were passaged 10 (P10) or 50 (P50) times and then differentiated via the GiWi or Gi(10/2)Wi protocols; then, cTnT expression was evaluated via flow cytometry. (f) The proportion of cells that expressed cTnT was presented as a percentage of the total number of cells (n = 10 different batches of differentiated cells), and (g) the total number of cTnT-expressing cells per well was quantified (n = 7 different batches of differentiated cells). *P < 0.05 vs GiWi.

