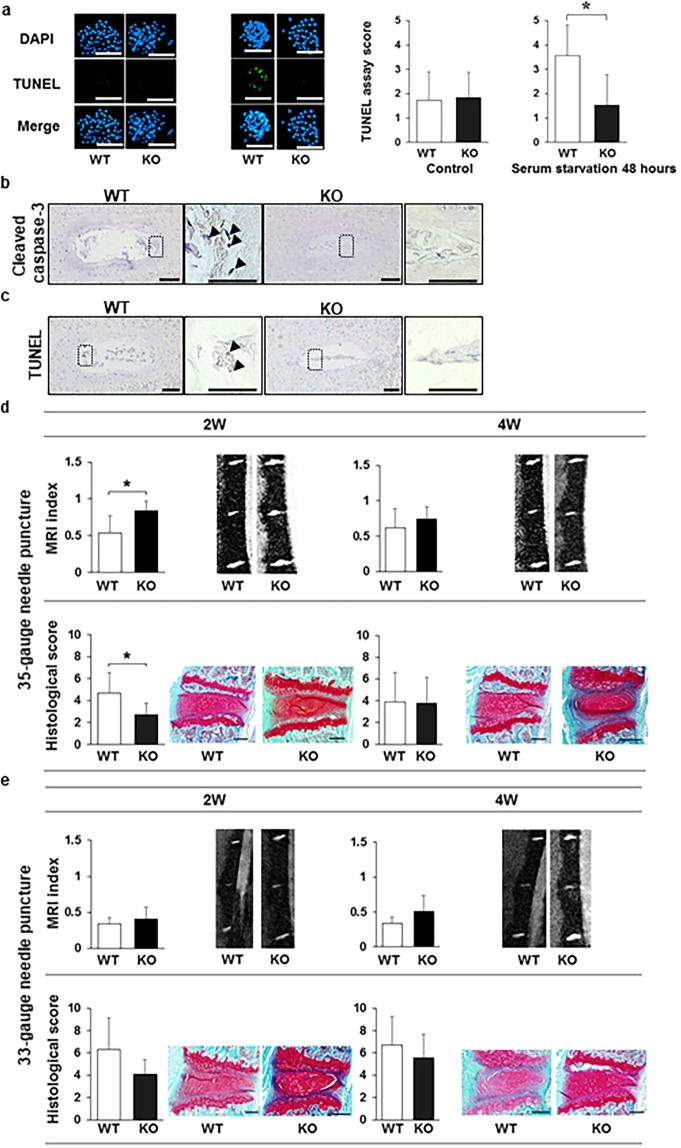
Figure 4.
Caspase-3 knockout (KO) increases the resistance of nucleus pulposus (NP) cells to apoptosis and inhibits progression of intervertebral disc (IVD) degeneration induced by injury. (a) Apoptosis was evaluated using the terminal deoxynucleotidyl transferase-mediated deoxyuridine triphosphate-biotin nick end labeling (TUNEL) assay in colony-forming unit spheres (CFU-S) from wild-type (WT) and KO mice subject to the serum starvation model (*p < 0.05). CFU-S were cultured on Lab-Tek Chamber Slides (Thermo Fisher Scientific) in Eagle’s minimum essential medium (Sigma-Aldrich) supplemented with 10% fetal bovine serum (FBS; Nichirei Bioscience, Tokyo, Japan), 0.5% penicillin/streptomycin (Wako, Osaka, Japan), and 0.25 μg/ml Fungizone (Thermo Fisher Scientific). The slides were placed in a humidified incubator (maintained at 37 °C and 5% O2 and CO2). Thereafter, CFU-S were incubated for 48 h in Eagle’s minimum essential medium (Sigma-Aldrich) supplemented with 0.5% penicillin/streptomycin (Wako) and 0.25 μg/ml Fungizone (Invitrogen). The nuclei were counterstained with DAPI, and the proportions of TUNEL-positive-cells to DAPI stained cells in each CFU-S was calculated. The proportions and intensities of TUNEL-positive-cells in each CFU-S were inverted into the semi-quantitative score ranging from 0 to 5 as the TUNEL assay score. Scale bars, 200 μm. Data are the mean ± SD. (b,c) Immunohistochemistry was used to determine the cleaved caspase-3 (b) expression and TUNEL positivity (c) in the NP of punctured IVDs of WT and KO mice. Arrows indicate positive cells. Scale bars, 100 μm; 50 μm in magnified images. The representative images for cleaved caspase-3 were two weeks after 33 G needle puncture for WT and two weeks after 35 G needle puncture for KO mice. The images for TUNEL were two weeks after 33 G needle puncture for WT and two weeks after 35 G needle puncture for KO mice. (d,e) MRI and histological analyses were used to detect degenerative changes in IVDs punctured using a 35 gauge (G) (d) or 33 G (e) needle. The MRI index was obtained as the product of the NP area and average signal intensity, using Analyze 10.0 software (AnalyzeDirect). The histological scores were obtained by adding the AF and NP scores, each ranging from 0 to 5. A total score ranging from 0 (intact) to 10 (the severest) was used to determine the severity of degeneration. The data represent the mean ± SD. Scale bars, 200 μm.

