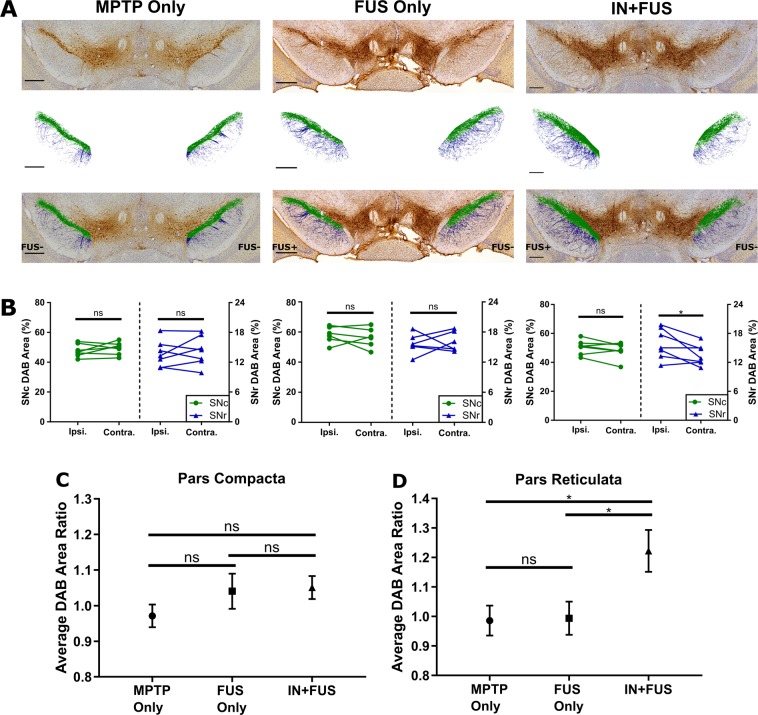
Figure 5.
TH+ immunoreactivity in the SNc and SNr. (A) Representative images of the SN within in each experimental group showing raw images (top row), extracted DAB staining from the raw (middle), and overlay of the extracted DAB staining on the raw images (bottom). The extracted pixels taken from the SNc and SNr were colored green and blue, respectively. Scale bar, 250 μm. (B) Average DAB area for each mouse in the ipsilateral and contralateral in both SNc and SNr for MPTP only (left, n = 7), FUS only (middle, n = 6), and IN+FUS (right, n = 7). Only the SNr in the IN+FUS group showed significant differences between the ipsilateral and contralateral DAB area (two-tailed paired Student’s t-test). Average DAB area ratio for the (C) SNc and the (D) SNr, computed by normalizing the ipsilateral DAB area by the contralateral DAB area within each group. The IN+FUS group in the SNr showed significant increase in average DAB area ratio when compared to both the MPTP only and the FUS only group (One-way ANOVA with Holm-Sidak corrected post-hoc comparisons). Error bars represent standard error mean. * - p < 0.05, ns – not significant (p > 0.05).

