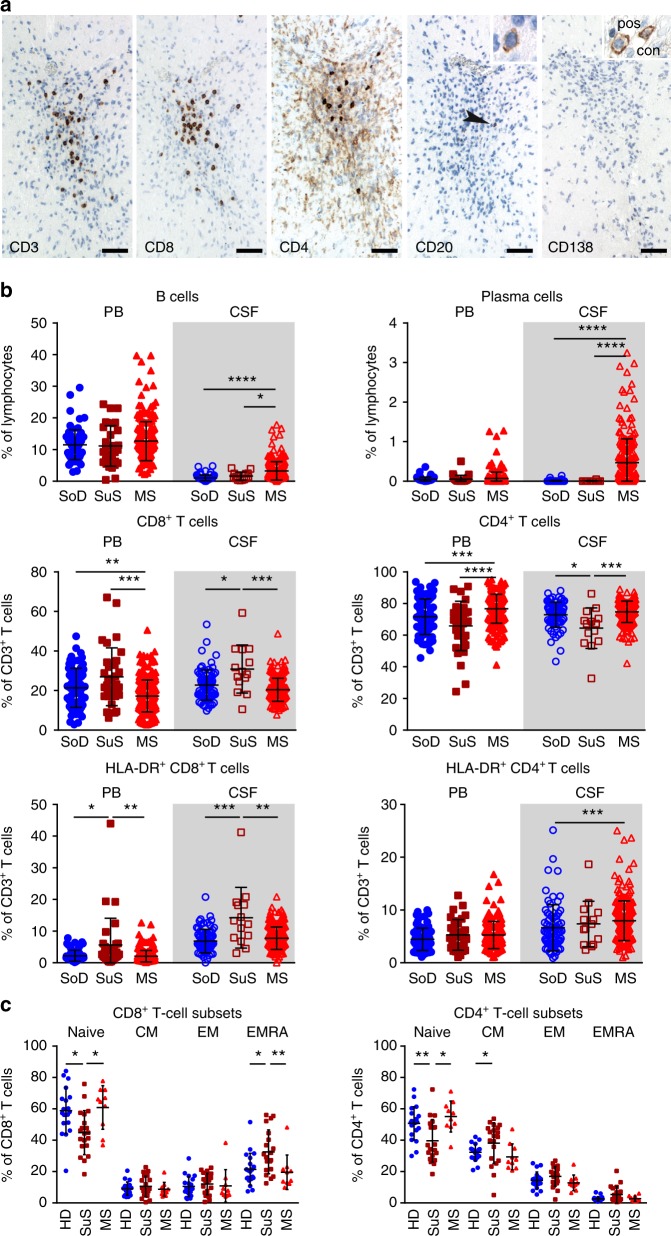
Fig. 1. Accumulation of activated CD8+ T cells in SuS.
a Brain lesion from a patient with SuS stained for T cell markers CD3, CD8, and CD4, B cell marker CD20, and the plasma cell marker CD138. Bars: 50 µm. Most T cells belong to the CD8+ T cell subset; light brown cells are most likely microglia cells; B cells are rare (arrowhead). One B cell is enlarged in the insert. CD138+ plasma cells are absent from this and other lesions. The insert of the CD138 staining shows plasma cells from a positive control (Rasmussen encephalitis). b Graphs representing proportions of CD19+ B cells (top left), CD138+ plasma cells (top right) among lymphocytes and CD8+ T cells (middle left), CD4+ T cells (middle right), HLA-DR+CD8+ T cells (bottom left), and HLA-DR+CD4+ T cells (bottom right) among CD3+ T cells in the peripheral blood (PB, closed symbols; SoD = 76; SuS = 32; MS = 227) and cerebrospinal fluid (CSF, open symbols; SoD = 76; SuS = 14; MS = 227) of somatoform disorders (SoD, blue circles), SuS (cayenne squares), and MS patients (red triangles up). c Quantification of naive, central memory (CM), effector memory (EM), and effector memory expressing CD45RA (EMRA) CD8+ (left) and CD4+ (right) T cell subsets in the peripheral blood of healhy donors (HD; n = 20, closed blue circles), SuS (n = 20, closed cayenne squares), and MS patients (n = 10, closed red triangles up). Statistical analysis was performed using Kruskal–Wallis test with Dunn’s post-test. Error bars indicate the mean ± s.d.; p values: *p < 0.05; **p < 0.01; ***p < 0.001; ****p < 0.0001. Source data are provided as a Source Data file.

