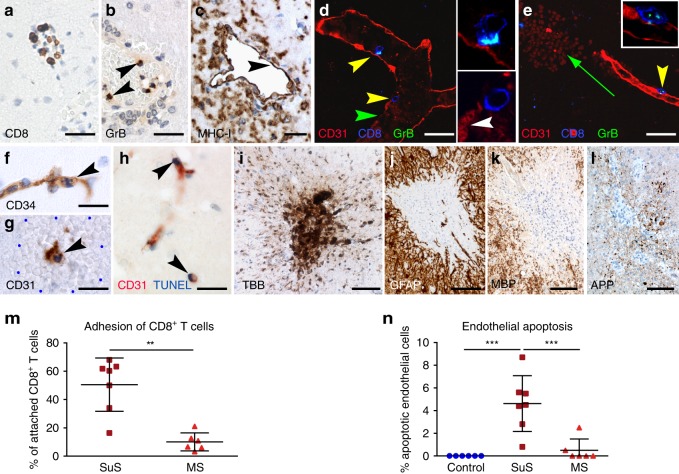
Fig. 4. CTLs accumulate in damaged microvessels of SuS patients CNS biopsies of SuS patients (n = 7).
a Accumulation of CD8+ T cells (brown) in a brain microvessel. b GrB+ cells in a brain microvessel; arrowheads indicate GrB+ cells attached to the vessel wall. c MHC class-I expression on ECs (arrowhead). Several leukocytes adhere to the endothelium. d Yellow arrowheads point to CD8+ T cells (blue) attached to CD31+ ECs (red). The enlargement of the upper CD8+ T cell shows its GrB+ (green) granules polarized toward the ECs. Owing to close proximity of the green GrB+ granules to the blue CD8+ cell membrane, these granules have a cyan blue color. The lower CD8+ T cell is migrating through the damaged (white arrowhead) vessel wall. e The same triple staining for GrB (green), CD8 (blue), and CD31 (red) shows a cytotoxic T cell attached to an intact vessel wall (yellow arrowhead). The upper left corner shows a microhemorrhage (green arrow) with parenchymal erythrocytes. f An apoptotic CD31+ EC with a condensed nucleus (arrowhead) within a microhemorrhage. g Staining for CD34 shows an EC with an apoptotic condensed (arrowhead) nucleus within a microhemorrhage encircled by the blue dots. h TUNEL-positive nuclei (arrowheads) of CD31+ ECs. i Turnbull blue (TBB) shows iron deposition around a blood vessel. j–l Small ischemic lesion combining loss of GFAP+ astrocytes, MBP+ myelin, and axonal damage shown by APP+ spheroids. m Proportions of CD8+ T cells in contact with ECs in brain specimen of SuS (cayenne squares, n = 7) and MS patients (red triangles up, n = 6). n Quantification of CD34+ endothelial apoptosis in brain specimen derived from non-inflammatory controls (blue circles, n = 6), SuS (cayenne squares, n = 7), and MS patients (red triangles up, n = 6). Scale bars: 20 µm (a, b, f–i), 25 µm (c–e), 200 µm (j, l). Statistical analysis was performed using Mann–Whitney test (m) or one-way ANOVA with Bonferroni post-test (n), respectively. Error bars indicate the mean ± s.d.; p values: **p < 0.01; ***p < 0.001. Source data are provided as a Source Data file.

