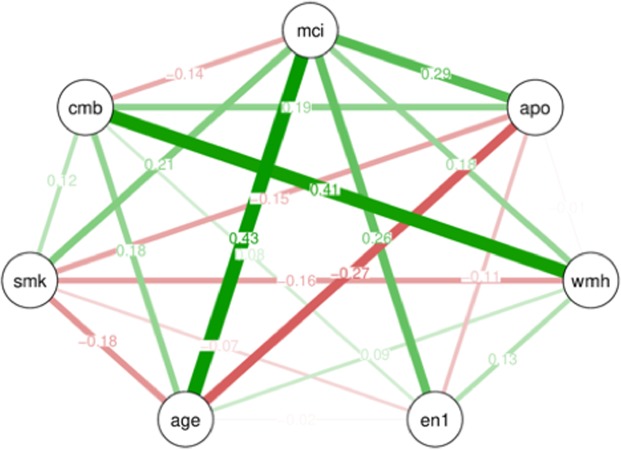
Figure 1.
Graphical modelling of factors used for the multivariable analyses. Line thickness is proportional to the number of patients that contributed to the comparison. Green lines indicate a positive relationship, and red lines indicate a negative relationship. Abbreviations: mci, mild cognitive impairment; apo, apolipoprotein E ε4 carrier; wmh, white matter hyperintensity; en1, enterotype I; age, patient’s age; smk, smoking habit; cmb, cerebral microbleeds.

