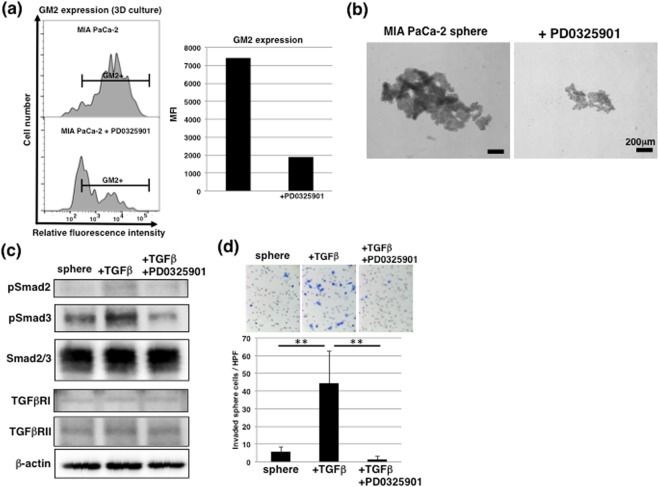
Figure 6.
Regulation of GM2 expression in CSC-like cells by MAPK pathway. (a) FACS analysis of GM2 expression in MIA PaCa-2 cultured in 3D conditions with or without 1 μM PD0325901 treatment. Mean fluorescence intensities (MFIs) are shown on the right side. (b) Phase contrast images of MIA PaCa-2 cultured in 3D conditions with or without 1 μM PD0325901 treatment. (c) Immunoblotting for TGF-β1 signaling in sphere cells with or without 1 μM PD0325901 treatment. Seven days after sphere formation, sphere cells were cultured for an additional 2 days with or without 10 ng/ml TGF-β1. The blot images were cropped to highlight the pSmad2, pSmad3, Smad2/3, TGFβRI, TGFβRII and β-actin bands using the anti-pSmad2, anti-pSmad3, anti-Smad2/3, anti-TGFβRI, anti-TGFβRII and anti-β-actin antibodies. The full blot images are presented in the Supplementary western blot dataset. (d) Matrigel invasion assays performed in sphere cells. **p < 0.01.

