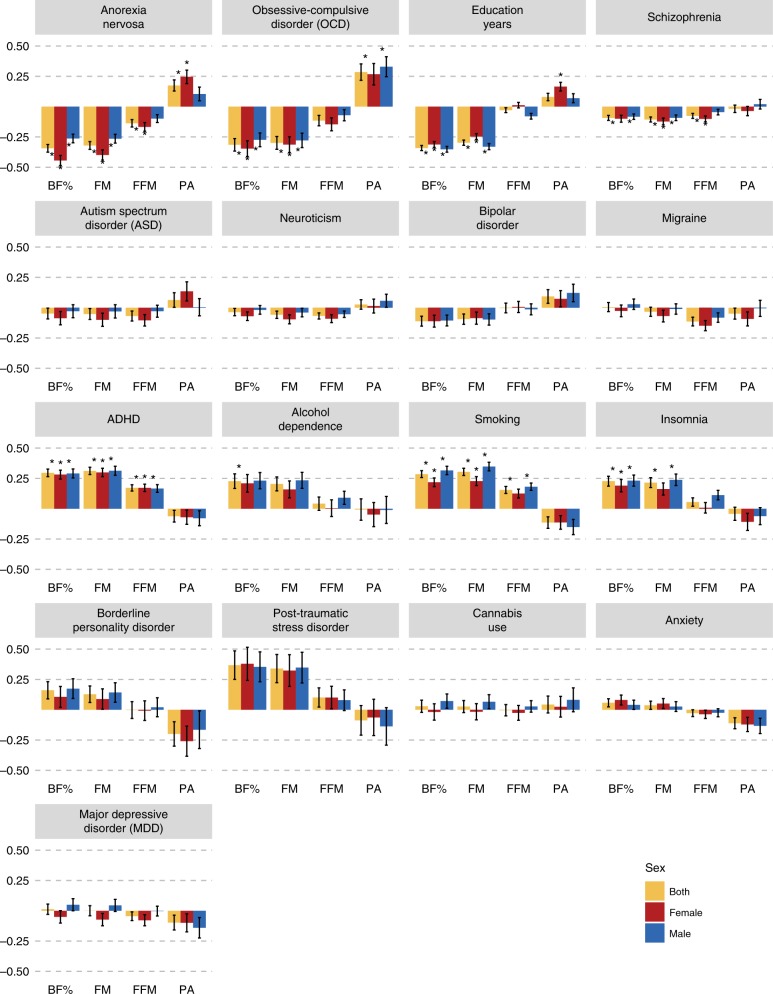
Fig. 1. Sex-specific genetic correlations across body composition, physical activity and psychiatric traits.
Sex-specific genetic correlations of body composition traits (n = up to 155,961) and physical activity (n = up to 66,224) with sex-combined psychiatric disorders (n = up to 77,096) and behavioural traits (n = up to 157,355). The autosomal genetic correlations were calculated by bivariate linkage disequilibrium score regression (LDSC). Coloured bars represent genetic correlations, error bars depict standard errors (s.e.) and asterisks indicate statistically significant genetic correlations with p values less than α = 0.0003. This threshold was calculated via the identification of the number of independent tests using matrix decomposition of the genetic correlation matrix and subsequent Bonferroni correction of α = 0.05 for 190 independent tests. ADHD = attention-deficit/hyperactivity disorder, BF% = body fat percentage, FFM = fat-free mass, FM = fat mass, PA = physical activity.

