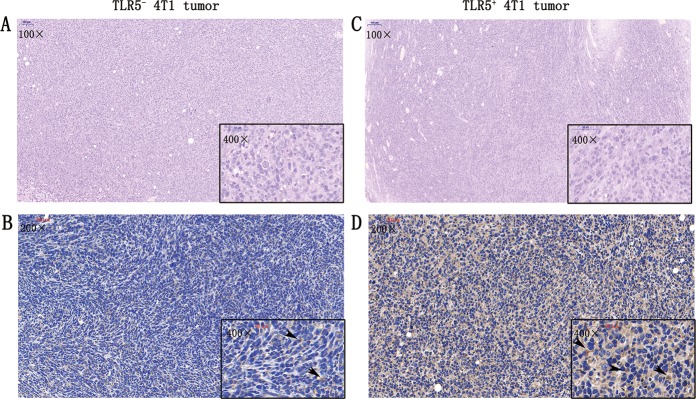
Fig. 7. H&E staining and immunohistochemistry staining.
For TLR5− 4T1 tumors, representative microscopy images H&E (a) and immunohistochemistry staining for TLR5 (b), black arrow refers to the positive area (brown) (a). For TLR5+ tumors, representative microscopy images the H&E staining (c) and immunohistochemistry staining for TLR5 (d), black arrow refers to the positive area (brown). n = 5, **p < 0.01. Representative results of five independent experiments were reported. The data were presented as the means ± SD. The data were analyzed by Student’s t test. *P < 0.05, **P < 0.01.

