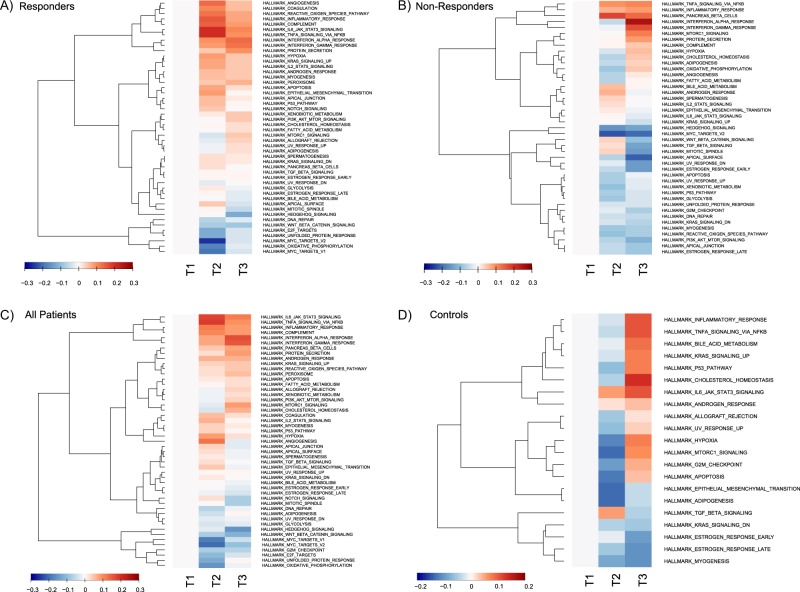
Fig. 2.
Heatmaps of estimated dynamics from significant gene sets in a responders, b non-responders, c patients, and d controls. The median gene expression over subjects is used for each trend. Each trend is zeroed at T1 to represent baseline expression. Each row is a group of genes having the same trend inside a gene set, while the columns are time points. Trends are hierarchically clustered. Trends become red as median expression is upregulated or blue as it is downregulated compared to the baseline value at T1. The colour key represents the median of the standardized estimation of gene expression over the group of participants for a given trend in a significant gene set. Non-converging gene sets were excluded. For non-responders, the gene set for peroxisome was excluded from visualisation due to non-homogeneous expression within the set.

