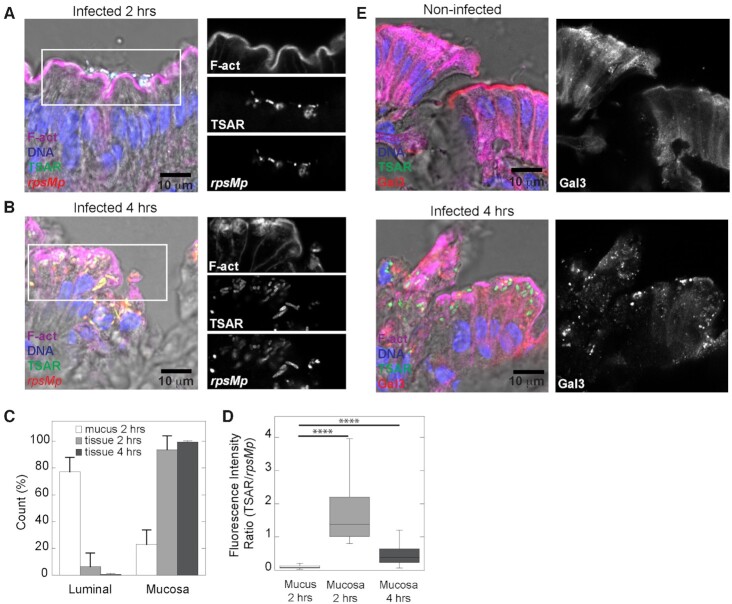
Figure 2.
In the early phase of invasion, secreting S. flexneri are associated with colonocytes. Colonic tissue sections infected or not with WT Shigella flexneri harboring pTSAR1.1 and labeled with phalloidin and DAPI were imaged using confocal microscopy. A micrograph overlay of infected tissue section at 2 h post-challenge (left panel). The right panels represent the indicated channel from the boxed area (A). A micrograph overlay of infected tissue section at 4 h post-challenge (left panel). The right panels represent the indicated channel from the boxed area (B). Count of luminal and mucosal bacteria in mucus-rich (white) and tissue foci both collected from animals infected for 2 h (light gray) and 4 h (dark grey); one way ANOVA with Bonferroni's post-tests were performed, P < 0.0001 (C). Comparison of the ratio of TSAR/rpsMp fluorescence intensity for bacteria found in the mucus at 2 h post-challenge (n = 392) or in the mucosa at 2 h (n = 103) or 4 h (n = 234) post-challenge. One way Anova with Bonferroni's post-tests were performed, P < 0.0001 (D). Micrograph overlays of infected tissue and non-infected tissue sections labeled as indicated above and with anti-galectin-3 antibody at 4 h post-challenge. The right panel show the galectin-3 channel (E). Sections are positioned with the lumen on top. Micrographs shown here together with those in Figure S3 (Supporting Information) are representative of infection foci observed in two animals.

