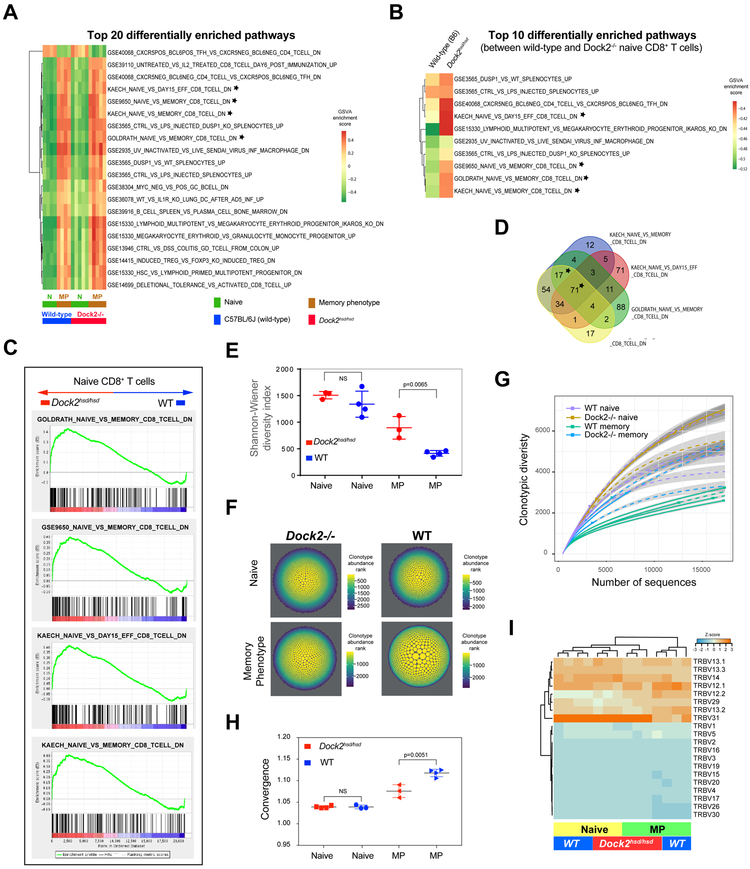
Figure 3: Naïve Dock2hsd/hsd T cells exhibit memory-like characteristics.
(A) Top twenty differentially enriched immunological gene signatures among naïve and memory phenotype CD8+ T cells from wild-type and Dock2hsd/hsd mice.
(B) Top ten differentially enriched immunological gene signatures between wild-type and Dock2hsd/hsd naïve CD8+ T cells. Gene sets linked to memory T cell differentiation are marked with a star in A and B. In both A and B, the heatmaps are colored by the GSVA enrichment score.
(C) Gene set enrichment analysis of genes upregulated in CD8+ naive (CD44loCD122−−) Dock2hsd/hsd T cells compared to WT naive CD8+ T cells. Significantly enriched pathways linked to memory T cell differentiation are shown.
(D) Overlap among the enriched gene sets linked to memory CD8+ T cell differentiation shown in A, B and C. Only the starred overlaps are significantly enriched in naive CD8+ (CD44loCD122−−) Dock2hsd/hsd T cells compared to wild-type by GSEA analysis.
(E,F and G) The repertoire diversity of naïve and memory phenotype (MP) CD8+ T cells from Dock2-deficient and wild-type mice assessed using the Shannon-Wiener diversity index (E) and visualized by scaling the area and color of the clonotypes by their abundance (F) or using a rarefaction plot (G).
(H) Repertoire convergence (F) (i.e. number of unique CDR3 nucleotide sequences that encode the same amino acid sequence) in naive (CD44loCD122−) and MP (CD44hiCD122+) T cells from WT and Dock2hsd/hsd mice. Statistical significance was assessed using unpaired two-tailed Student’s t test.
(I) A hierarchically clustered heatmap of the frequency of TCR Vβ gene segment usage in naive (CD44loCD122−−) and MP (CD44hiCD122+) CD8+ T cells from Dockhsd/hsd and WT mice.

