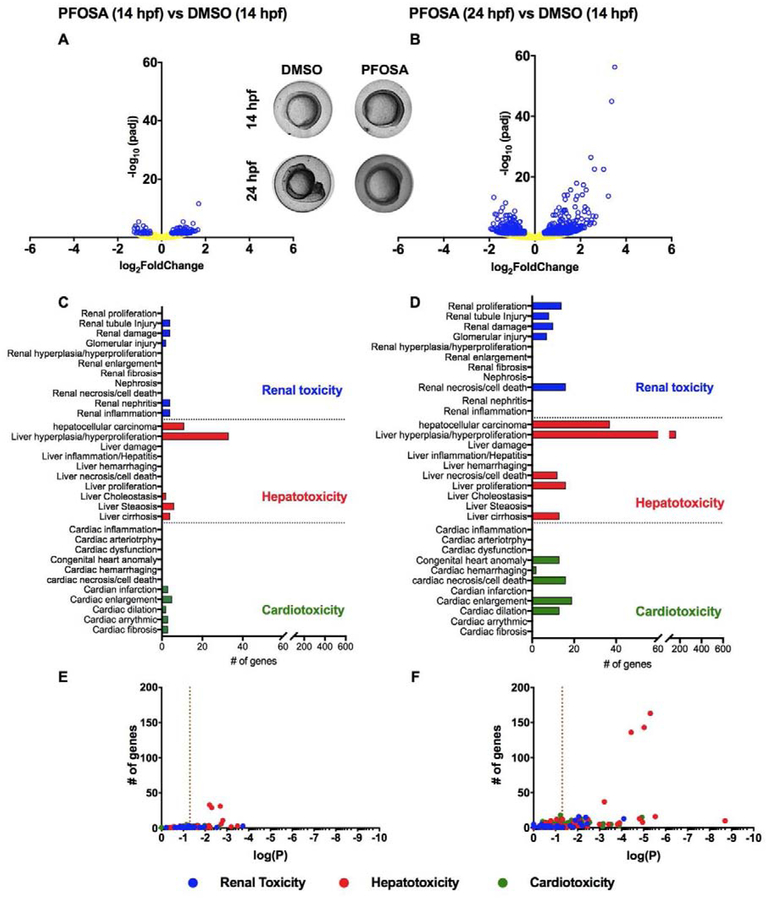
Figure 5.
Volcano plots representing differentially expressed genes based on mRNA-sequencing of embryos exposed to vehicle (0.1% DMSO) or 12.5 μM PFOSA from 0.75–14 hpf and 0.75–24 hpf, followed by differential gene expression analysis between pairs of treatments within Bluebee’s DESeq 1.3 pipeline (A-B). Blue dots represent transcripts with padj<0.05. Inset shows representative images from 14 and 24 hpf embryos. Transcripts associated with cardiotoxicity, hepatotoxicity and renal toxicity as revealed by IPA-based Tox Analysis of differentially altered transcripts with padj<0.05 (C-D). Scatterplots representing log(P) values relative to the number of genes for altered pathways related to cardiotoxicity, hepatotoxicity and renal toxicity (E-F). Vertical dashed line represents a p-value = 0.05.

