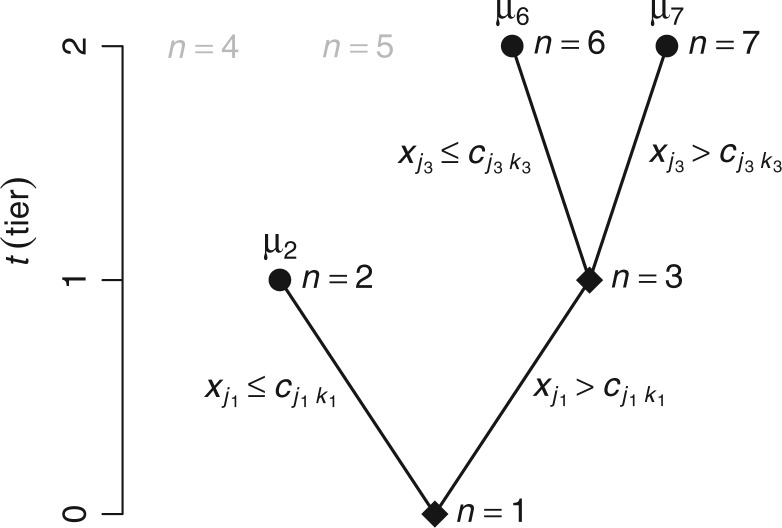
Fig. 1.
This is a diagram of a binary regression tree. On the vertical axis, we have the tier,  , i.e., in each tier, we may have nodes
  . This tree has branch decisions (diamonds) at nodes
  and terminal leaf nodes (circles) at
  with corresponding output values of
  . At branches
  , the splitting variable is
  and the cutpoint is
  , i.e., if
  , then go to node
  , otherwise,
  . Note that nodes
  (in gray) do not appear since node
  is a leaf. This tree is denoted by
  and a corresponding regression function
  where
where  is a vector of covariates,
  .
.  represent the branch decision rules of the form
  and is composed of ordered triples,
  :
:  for the node,
  for covariate
  and
and  for the cutpoint
  . So, here we have
  .
.  represents leaves and is composed of ordered pairs,
  :
:  for the node and
  for the outcome value. So,
  . The regression function,
  , climbs the tree. For example, suppose
  and
and  , then
  .
.

