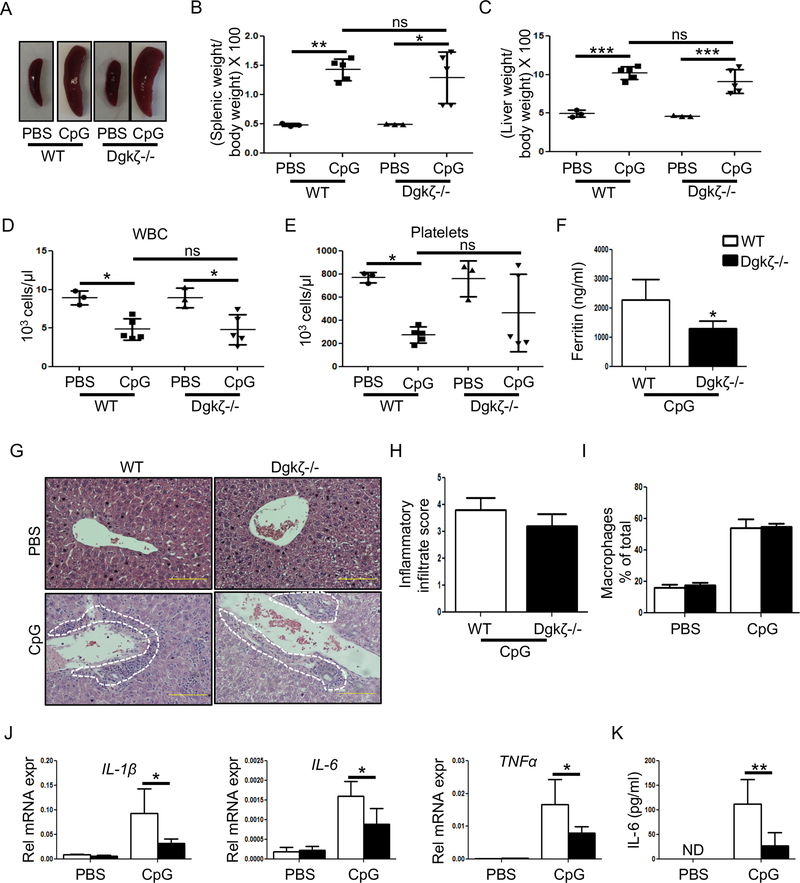
Figure 2. Loss of Dgkζ attenuates inflammatory cytokine production in the TLR9 induced-CSS model.
C57Bl/6 WT and Dgkζ-/- mice were injected with either PBS or CpG (50 μg) every other day for 8 days. The mice were euthanized within 24 hr after the last CpG injection for analysis. (A-B) Representative images of spleen size (A) and measurements of spleen weight in WT and Dgkζ-/- mice injected with PBS or CpG to induce CSS (B). (C) Development of hepatomegaly determined by measuring the ratio of liver weight to body weight x 100. (D-E) WBC (D) and platelet (E) counts in mice with CSS. (F) Serum ferritin levels from WT and Dgkζ-/- mice measured on day 9 after CpG-induced CSS. (G) Representative H&E stained liver sections highlighting presence of inflammatory infiltrates (indicated by white dotted lines). (H) The liver inflammatory infiltrate score determined by assessing the extent of inflammatory cells around the veins and parenchyma, with 0 being the lowest and 4 being the highest given score. (I) The quantification of macrophages in the liver of WT and Dgkζ deficient mice determined by FACS in PBS controls and after CpG-induced CSS. (J) The transcripts levels of inflammatory cytokines measured in the liver of WT and Dgkζ deficient mice in PBS controls and after CpG-induced CSS. (K) IL-6 levels in the blood analyzed by performing ELISA in the serum. Individual symbols in Figure B-E represent 1 mouse with horizontal lines representing the mean values. Bars in Figures F-K (n= 5–9 mice/group) represents mean and SD. Statistical significance was determined by two-tailed Student’s t test or two-way ANOVA for multiple comparison. * p<0.05, **p<0.01, ***p<0.001.

