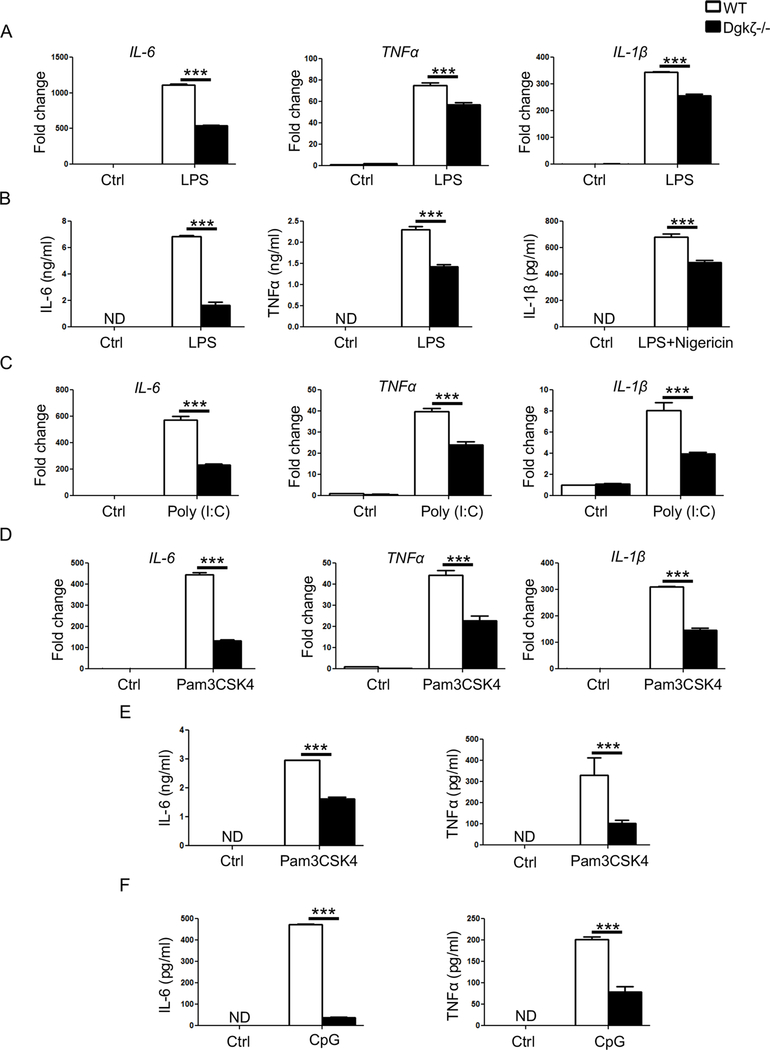
Figure 3. Decreased cytokine production in macrophages from Dgkζ-/- mice.
(A) RT-qPCR analysis of inflammatory cytokines in BMMs derived either from WT or Dgkζ-/- mice and stimulated with 100 ng/ml of LPS for 4 hr. Data are expressed as fold change in gene expression in comparison to unstimulated WT BMMs. (B) Levels of IL-6 and TNFα measured by ELISA in the supernatant of BMMs stimulated with 100 ng/ml of LPS for 24 hr. IL-1β protein levels determined after stimulation with LPS (100 ng/ml) for 2 hrs followed by 7.5 μM nigericin for 15 mins. (C-D) RT-qPCR analysis of IL-6, TNFα and IL-1β in BMMs from WT or Dgkζ-/- mice stimulated for 4 hr with 40 μg/ml of poly (I:C) (C) or 50 ng/ml of pam3CSK4 (D). Data are expressed as fold change in gene expression in comparison to unstimulated WT BMMs. (E-F) IL-6 and TNFα measured by ELISA in the supernatant of BMMs from WT and Dgkζ-/- mice stimulated with 50 ng/ml of pam3CSK4 (E) or 1 μM of CpG (F) for 24 hr. Statistical significance was determined by two-way ANOVA. * p<0.05, **p<0.01, ***p<0.001.

