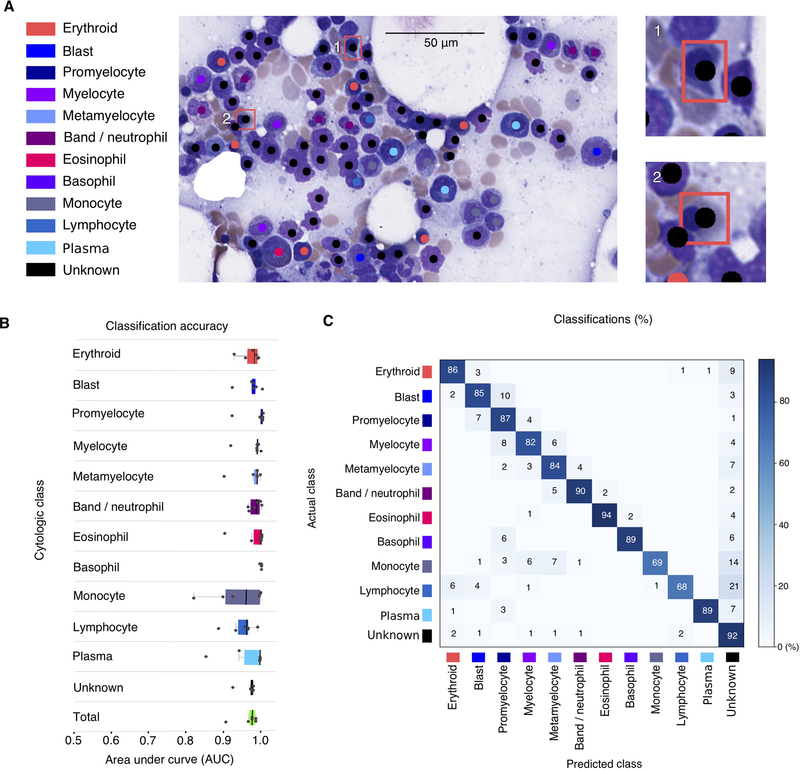
Figure 4. Cell classification results.
(A) Sample classification result on test ROI. Predicted class and location of detected cells is indicated with color-code dots. Classification errors are indicated with a bounding box in sub panels 1 and 2, colored to indicate the annotated cell class. (B) Classification area-under-curve on cross-validation test sets. Each point represents the AUC of one class in one testing fold. Total AUC was calculated as the average AUC over all classes (unweighted by class proportions). (C) Cross-validation confusion matrix indicating the classification errors that were made for each class. Rows display the true cell class while columns indicate the cell type predicted by the classifier. Values are normalized as percentages across rows. The diagonal shows the proportion of TPs for each cell class. Values outside of the diagonal represent misclassification rates. Results presented are aggregated over all cross-validation folds.

