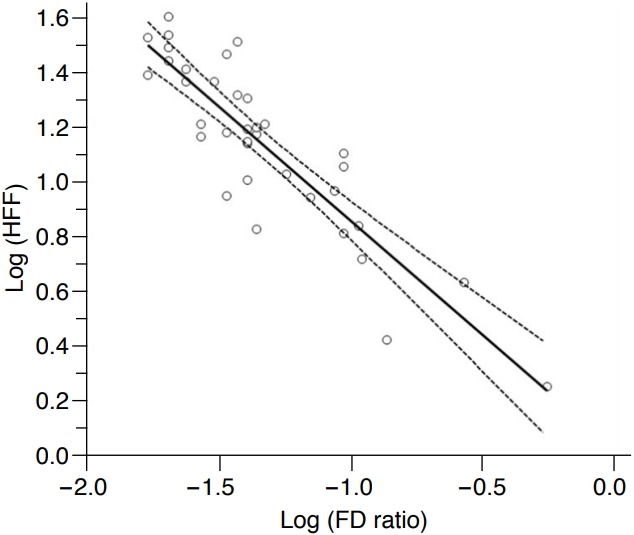
Fig. 2. Correlation between the focal disturbance (FD) ratio and the hepatic fat fraction (HFF) at the initial examinations of all 36 patients.

Regression plot showing a strong negative linear correlation between the FD ratio and the HFF after the logarithmic transformation of both variables; the correlation coefficient was -0.888 (P<0.001). The solid line indicates the regression line, and the lines with small dots are the 95% confidence intervals.
