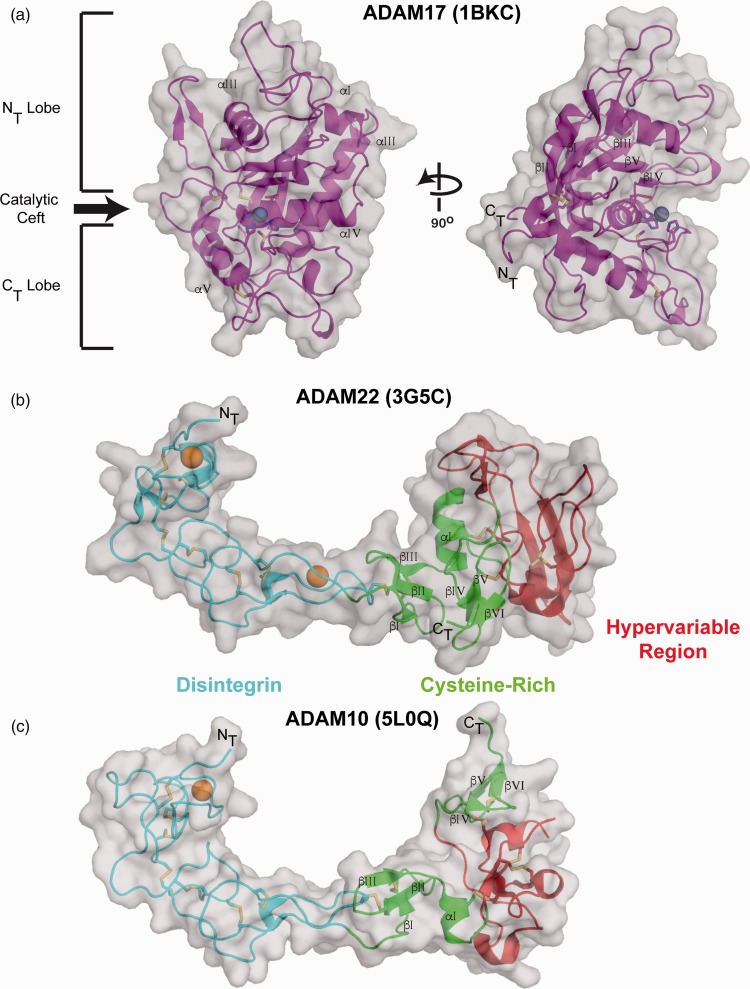
Figure 2.
M domain and D + C domain structures. (a) The ADAM17 M domain (PDB: 1BKC) is shown in carton representation with a transparent grey surface. The catalytic cleft and structurally conserved subdomains are indicated on the left. The active site histidine, glutamic acid, and methionine residues are represented as sticks with the bound zinc ion as a grey sphere. The bound inhibitor has been removed in these representations. The D + C domains of (b) ADAM22 (PDB: 3G5C) and (c) ADAM10 (PDB: 5L0Q) are shown in cartoon representation with a transparent grey surface. The D domain is in cyan, the C domain is in green, and the HVR is in red. Conserved structural α-helices and β-strands are labeled in the individual domains and disulfide bonds are represented as sticks. Bound calcium ions in the ADAM22 and ADAM10 D domains are represented as orange spheres. The M and EGF domains of ADAM22 have been removed from this representation. (A color version of this figure is available in the online journal.)

