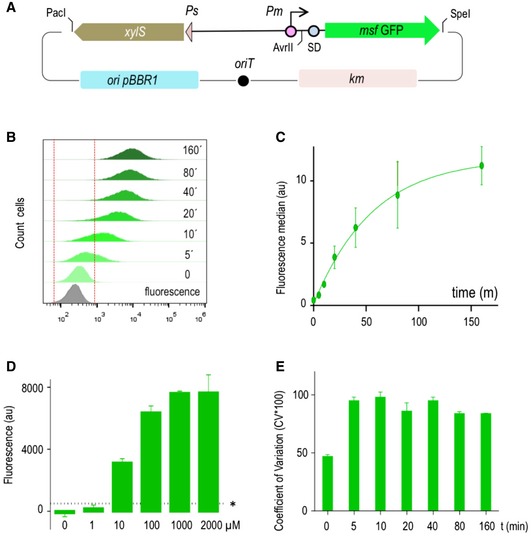
Figure 1. Performance of a standardized XylS/Pm‐based expression system.

- Schematic representation of the pS238M plasmid, harbouring an msf•GFP gene as reporter. Main features of the DNA backbone are indicated.
- Evaluation by flow cytometry experiments of the basal (t = 0) and induced expression of GFP along time upon induction of the system with a fixed (1.0 mM) concentration of 3MBz, at the indicated time points. The same Escherichia coli strain was transformed with a promoterless GFP version of the otherwise identical plasmid backbone (grey plot), and this region was the considered as indicative no‐fluorescence (indicated between red dashed lines).
- Representation of the fluorescence median and SD values of three independent experiments performed as described in the previous panel.
- Dose response of the XylS/Pm system. GFP fluorescence—normalized to OD600 in all cases—was monitored with respect to the control strain transformed with the empty vector to evaluate auto‐fluorescence in the absence and in the presence of increasing concentrations of inducer (3MBz) as indicated. Asterisk indicates the baseline sensitivity of the instrument. Data represent the mean and SD values of three independent experiments with eight technical replicates each performed in microtiter plates.
- Cell‐to‐cell homogeneity was evaluated by means of the coefficient of variation (expressed as a percentage CV*100) of population samples analysed before and upon inducer addition at the indicated time points. Data correspond to mean CV*100 values with SD obtained from three independent experiments.
