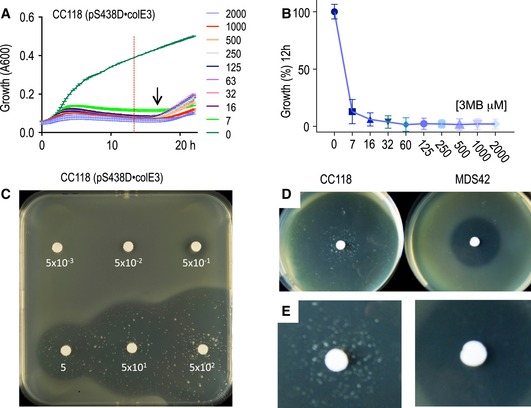
Figure 5. The digitalizer module reduces XylS/Pm basal expression to virtually zero.

- Growth curves of CC118 Escherichia coli cells transformed with the highly toxic colE3 gene cloned in a plasmid harbouring the XylS/Pm digitalized device described in Fig 4 without (0) or with different concentrations of inducer (3MBz 0.007–2.0 mM). The arrow indicates the approximate time when cells that escaped the action of the colicin E3. The plots represent the mean and SD growth values every 15 min, obtained from two independent experiments with eight technical replicates each. Note that the horizontal lines crossing the growth curves correspond to the limits of the vertical error bars representing the SD estimate. The red dotted vertical line is the time point selected for (B).
- Percentage of surviving cells 12 h after induction with the same range of 3MBz corresponding to the time point marked with the red dashed line depicted in (A). Growth percentage is represented as mean ± SD values from the experiments shown in (A).
- Top agar plates spread with a culture of E. coli CC118 cells harbouring the colE3 gene as described in (A), induced with discs or papers soaked in 3MBz at the indicated concentrations. Halos of different size, indicating growth arrest as consequence of the toxin expression, correlate with the inducer concentration. A few survivors managed to escape the action of the colicin E3 nuclease.
- Comparison of top agar halos generated by induction of the described colE3‐expressing construct carried by E. coli CC118 strain (left) or a IS‐minus E. coli MDS42 strain (right).
- Appearance of escapers in the inhibition halos upon colicin E3 induction in the CC118 strain (left) versus the MDS42 strain (right) pinpointing ISs as the major source of mutations inactivating performance of the circuit.
