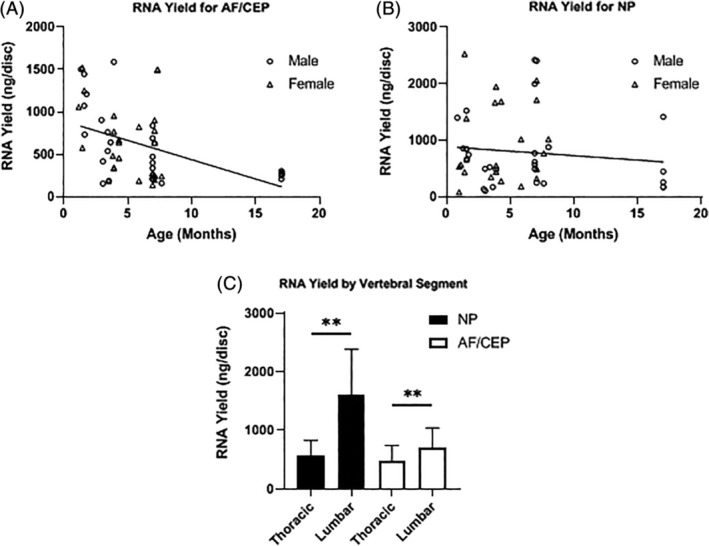
Figure 4.

RNA yield by age, gender and IVD structure. A and B, Changing yield of RNA (ng/disc) over time by IVD compartments (n = 5 per age, linear regression for nonzero slope, *P < .05). C, RNA yield by vertebral segment (n = 5 per age, Mann‐Whitney U Test, **P < .01)
