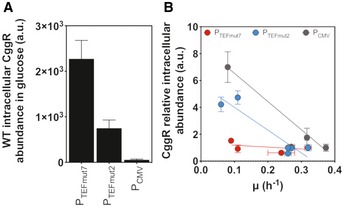
Figure 4. CggR intracellular levels and expression profile with different promoters, strains, and conditions.

- CggR intracellular abundance in the wild‐type (WT) strain on glucose strongly varies with the promoter used. The CggR intracellular levels were quantified by proteomics in steady‐state cultures grown in minimal media with glucose as carbon source at a final concentration of 10 g/l. Error bars represent the standard deviation of at least three replicate experiments.
- The relative abundance of CggR (normalized to the abundance measured on glucose and the same promoter) is almost constant with PTEFmut7 across multiple growth rates in WT and TM6 cells, but not with PTEFmut2 and PCMV. The CggR intracellular levels were quantified by proteomics in steady‐state cultures grown in minimal media with glucose, galactose, maltose, or pyruvate as carbon sources at a final concentration of 10 g/l. WT data include all three promoters, whereas TM6 only includes the PTEFmut2 and PTEFmut7 data. Error bars represent the standard deviation of at least three replicate experiments.
