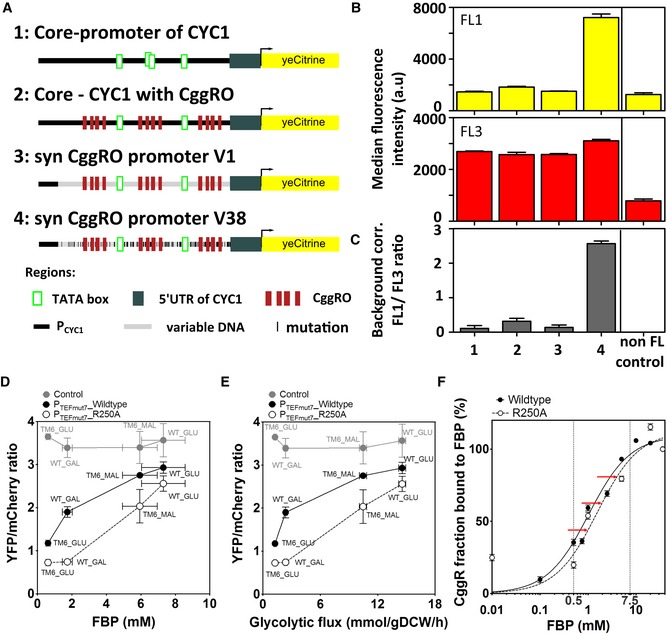
Figure 6. The engineered flux‐sensor reports glycolytic flux with a high dynamic flux range.

-
AOverview about the different design steps in our promotor engineering strategy (cf. also Appendix Fig S4).
-
BThe four reporter plasmids were transferred to the wild‐type strain containing the CggR (R250A) under the control of the PTEFmut7. The strength of the four promoters was assessed by quantifying YFP (FL1) and mCherry (FL3) fluorescence in exponentially growing wild‐type cells in minimal medium with 10 g/l glucose. The FL1 and FL3 fluorescence shown is the non‐background‐corrected median of 100,000 cell events. The non‐FL control is the signal from a wild‐type strain grown under the same conditions. Error bars represent the standard deviation of three independent experiments.
-
CThe background fluorescence, assessed by the wild‐type harboring the YCplac33 plasmid, was subtracted from FL1 and FL3. The final reporter activity is the ratio of the background‐corrected YFP and mCherry values. Error bars represent the standard deviation of three independently determined ratios from three replicate experiments.
-
D, EReporter activity of the sensor across (D) multiple FBP levels and (E) glycolytic fluxes. The glycolytic flux is reported as the flux between the metabolites fructose 6‐phosphate (F6P) and fructose‐1,6‐bisphosphate (FBP). Glycolytic fluxes were here estimated on the basis of physiological and metabolome data and a novel method to estimate intracellular fluxes (Niebel et al, 2019). Reporter activity is given by the YFP/mCherry ratio, calculated through the quantification of YFP and mCherry fluorescence along culture time using flow cytometry. Both YFP and mCherry fluorescence levels were first corrected for background using the same strains harboring the YCplac33 plasmid (Appendix Table S8). The control is the wild type and TM6 strains expressing only the reporter plasmid without CggR. Error bars represent the standard deviation of at least three replicate experiments.
-
FFraction of CggR bound to FBP across FBP concentrations. The red arrows indicate the shift in the percentage of CggR bound to FBP achieved in the R250A variant. The percentage of CggR molecules bound to FBP was calculated after normalizing the T m values for unbound/bound state using the T m at 0 mM FBP as unbound and at 36 mM (corresponding to maximum FBP concentration used) as total bound states. The curve fitting of the normalized values of CggR fraction bound to FBP was performed using a one‐site specific binding model in GraphPad. The solid line corresponds to the wild‐type CggR and the dashed line to the R250A variant. Vertical lines delimit the physiological FBP range.
