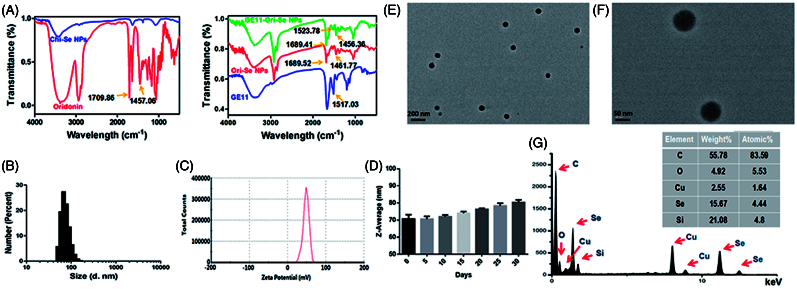
Figure 1.
Characterization of GE11-Ori-Se NPs. (A) FTIR spectra of oridonin, Chi-SeNPs, Ori-Se NPs, GE11 peptide and GE11-Ori-Se NPs. (B) Size distribution of GE11-Ori-Se NPs and (C) Zeta potential distribution of GE11-Ori-Se NPs. (D) time-course of size distribution of GE11-Ori-Se NPs. (E,F) High-resolution TEM images of GE11-Ori-Se NPs, scale bars are 200 and 50 nm for (E) and (F), respectively. (G) TEM-EDS analysis of GE11-Ori-Se NPs.

