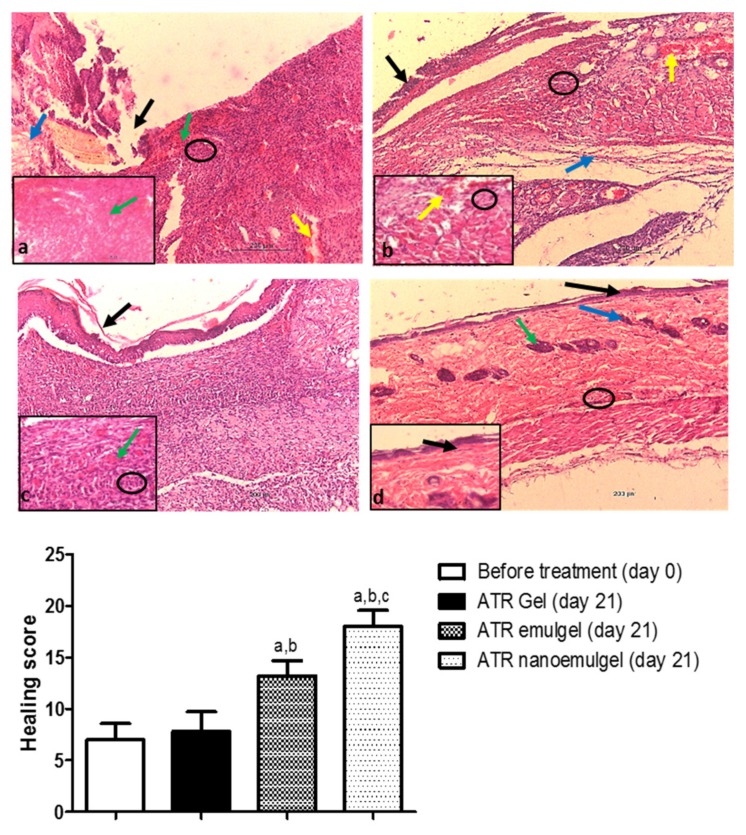
Figure 5.
Upper panel: Photomicrographs of the rat skin tissue. (a) Wound area before treatment at day 0. Absence of epithelization in the epidermal layer (black arrow). Dermal layer shows loss of normal arrangement of collagen fibers (blue arrow). Severe congestion (green arrows), hemorrhage (yellow arrow), and inflammatory cell infiltrations (black circle) are observed. (b) Atorvastatin (ATR) gel-treated group at day 21. Partial epithelialization (black arrow) is exhibited. Dermal layer has granulation tissue (blue arrow) with vascular congestion and hemorrhage (yellow arrows) and mild inflammatory cell infiltrations (black circles). (c) ATR emulgel-treated group at day 21 has complete epithelization with formation of thin keratin layer (black arrow). The underlying dermal layer shows vascular granulation tissues in addition to fibrous connective tissues (green arrow) and inflammatory cell infiltrations (black circle). (d) ATR nanoemulgel-treated group at day 21. Complete epithelization of the epidermis (black arrows) with presence of skin hair follicles (blue arrow) and sebaceous glands (green arrow) are exhibited. There are few inflammatory cell infiltrations (black circle). (H&E ×200 µm and inset ×50 µm). Lower panel: A semi-quantitative analysis of healing status in rats at day 0 before the treatment and after 21 days of receiving topical ATR gel, ATR emulgel, and ATR nanoemulgel. Healing status is assessed according to healing score. Values are expressed as mean ± as mean ± standard deviation (SD) of five readings and were analyzed by one-way ANOVA followed by Tukey’s multiple comparisons test. a,b,c p < 0.05 compared to non-treated, ATR gel-treated, and ATR emulgel-treated groups, respectively.

