Figure 4.

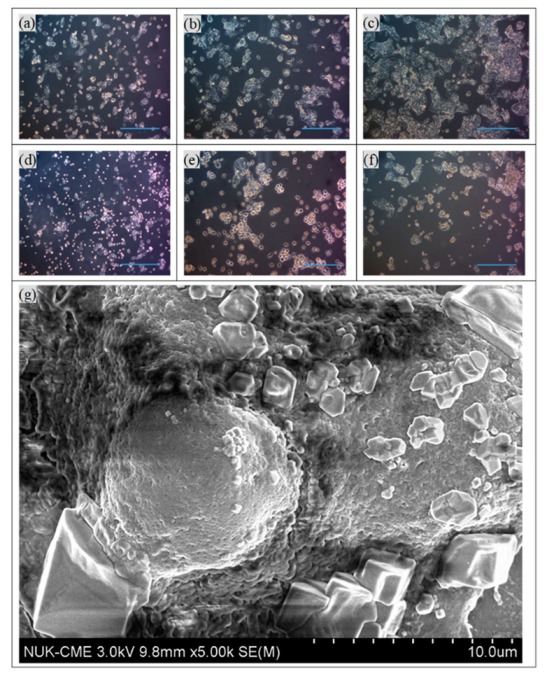
Optical images of HepG2 cells on days 1–3, (a)–(c), and 2 × 10⁴ cells/well of NK-92 cells added to HepG2 cells on days 1–3, (d)–(f). Scale bar: 300 μm. (g) SEM image of a HepG2 cell with many NK-92 cells.

Optical images of HepG2 cells on days 1–3, (a)–(c), and 2 × 10⁴ cells/well of NK-92 cells added to HepG2 cells on days 1–3, (d)–(f). Scale bar: 300 μm. (g) SEM image of a HepG2 cell with many NK-92 cells.