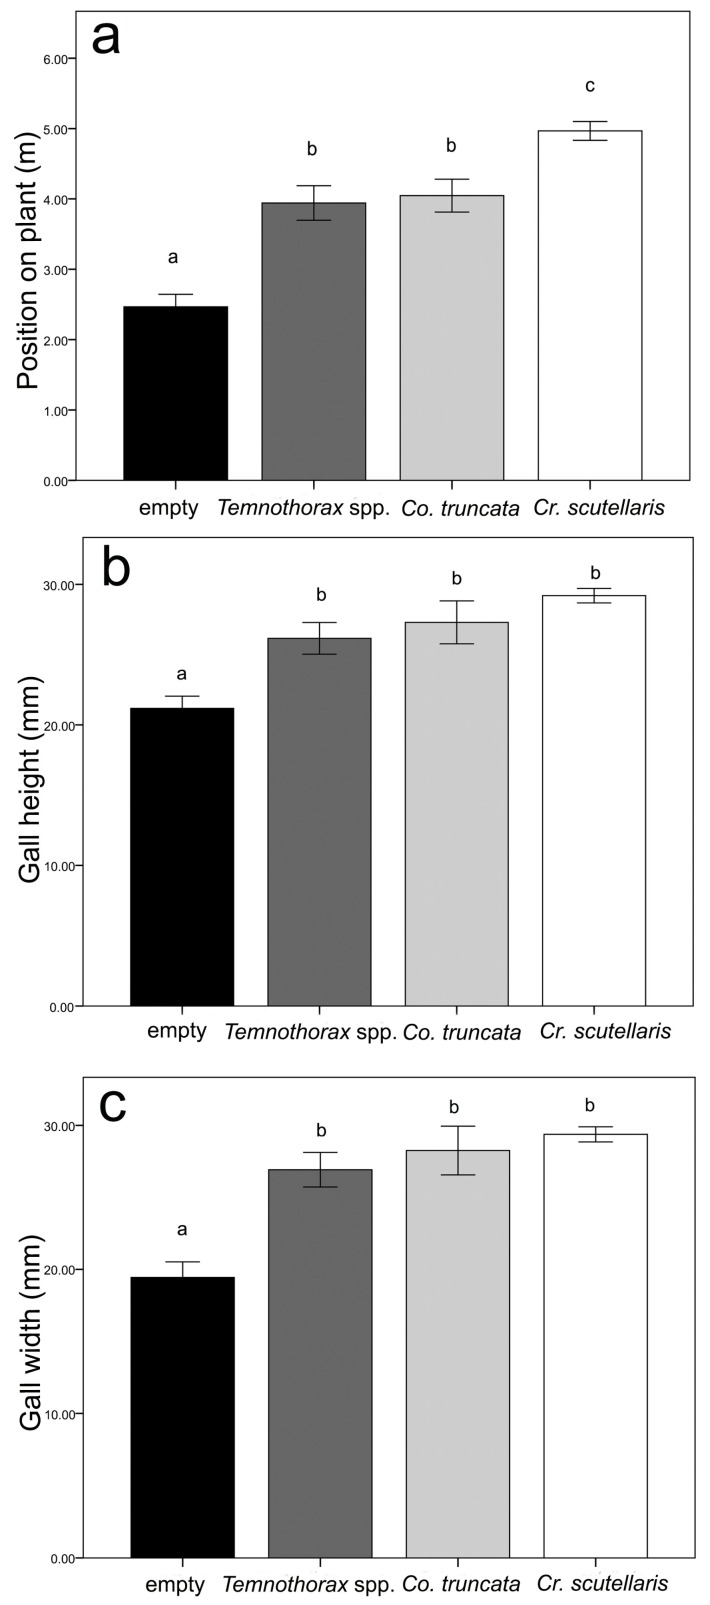
Figure 3.
Graphs showing gall preferences of the different ant species according to the data collected in Experiment 1. The gall preferences are measured as gall position on the plant (a), gall height (b), and gall width (c). The SE interval is shown for each bar. The bars with the same letter are not statistically different (One-way ANOVA, see text for further details).

