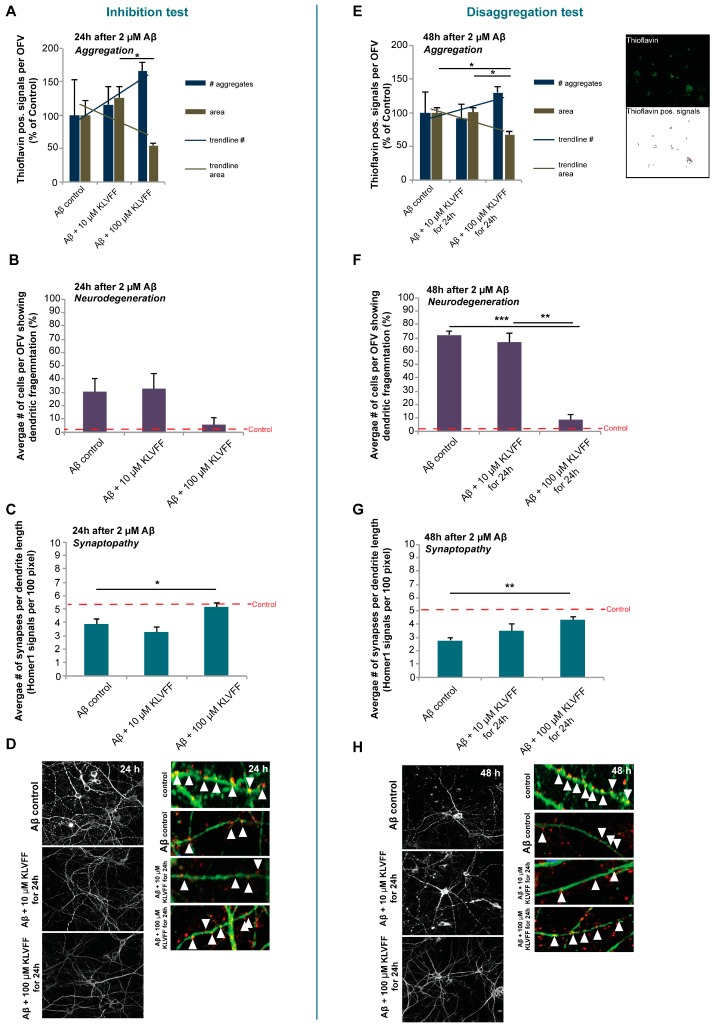
Figure 2.
(A,E) The number and area (in pixel2) of aggregates visualized by Thioflavin staining and measured in three optic fields of view (OFV). The results are shown in percentage of control. (B,F) The number of cells showing fragmented dendrites (microtubule-associated protein 2 (MAP2) staining) was analyzed. (C,G) A “synaptopathy” was evaluated by measuring the number of Homer1 positive signals per dendrite length. Three optic fields of view (OFV) with at least ten cells were evaluated. (D) Left panel: MAP2 staining showing dendritic fragmentation as an early sign of neurodegeneration. Right panel: MAP2 (green) and Homer1 (red) staining visualizing synapses along a dendrite. (H) Left panel: MAP2 staining showing dendritic fragmentation as an early sign of neurodegeneration. Right panel: MAP2 (green) and Homer1 (red) staining visualizing synapses along a dendrite. A more detailed caption with the relevant statistical analysis data is reported in the supplementary material.

