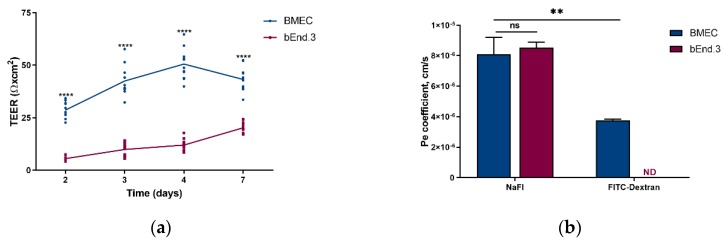
Figure 3.
(a) Transendothelial electrical resistance (TEER, expressed as Ω × cm2) and (b) endothelial Pe for sodium fluorescein (NaFl) and FITC-dextran (Pe, expressed in cm/s) of the blood–brain barrier models built from mouse primary brain endothelial cells (BMEC, blue) and from mouse brain endothelial cell line (bEnd.3, red) at day 7. All data are presented as means ± SD (n = 12 for TEER, n = 4 for Pe). Statistical analysis: unpaired t test with Welch’s correction (ns: p ≥ 0.0332, **** p < 0.0001, ND-not detected).

