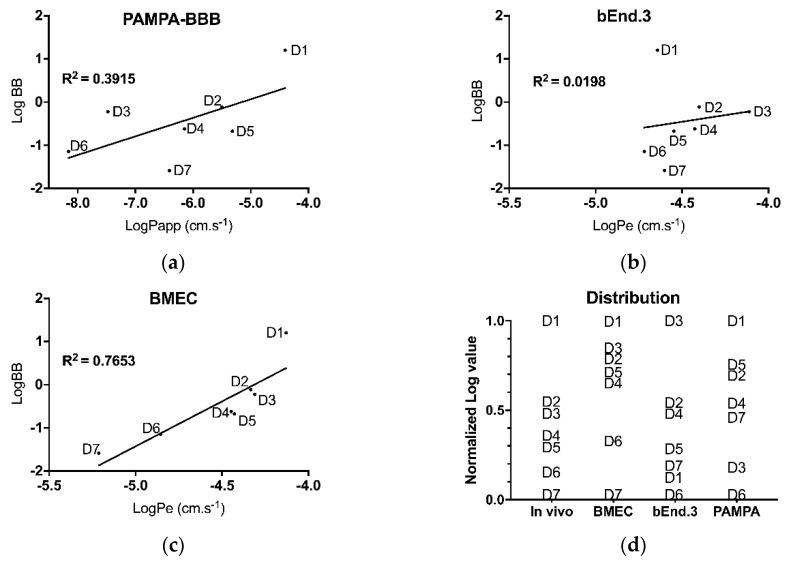
Figure 5.
Linear regression plots for in vitro Pe–in vivo log BB correlation (IVIVC) using different models for seven drugs: (a) PAMPA-BBB, (b) bEnd.3 model and (c) BMEC. Pe measurements were realized on day 7. LogBB were quantify 2 h post drugs injection. (d) Distribution of drug ranking according to the selected model. D1: chlorpromazine; D2: midazolam, D3 caffeine, D4: theophylline, D5: verapamil, D6: atenolol, D7: tenoxicam. Each point indicates the average Log BB or Log Pe for a given drug (n ≥ 4).

