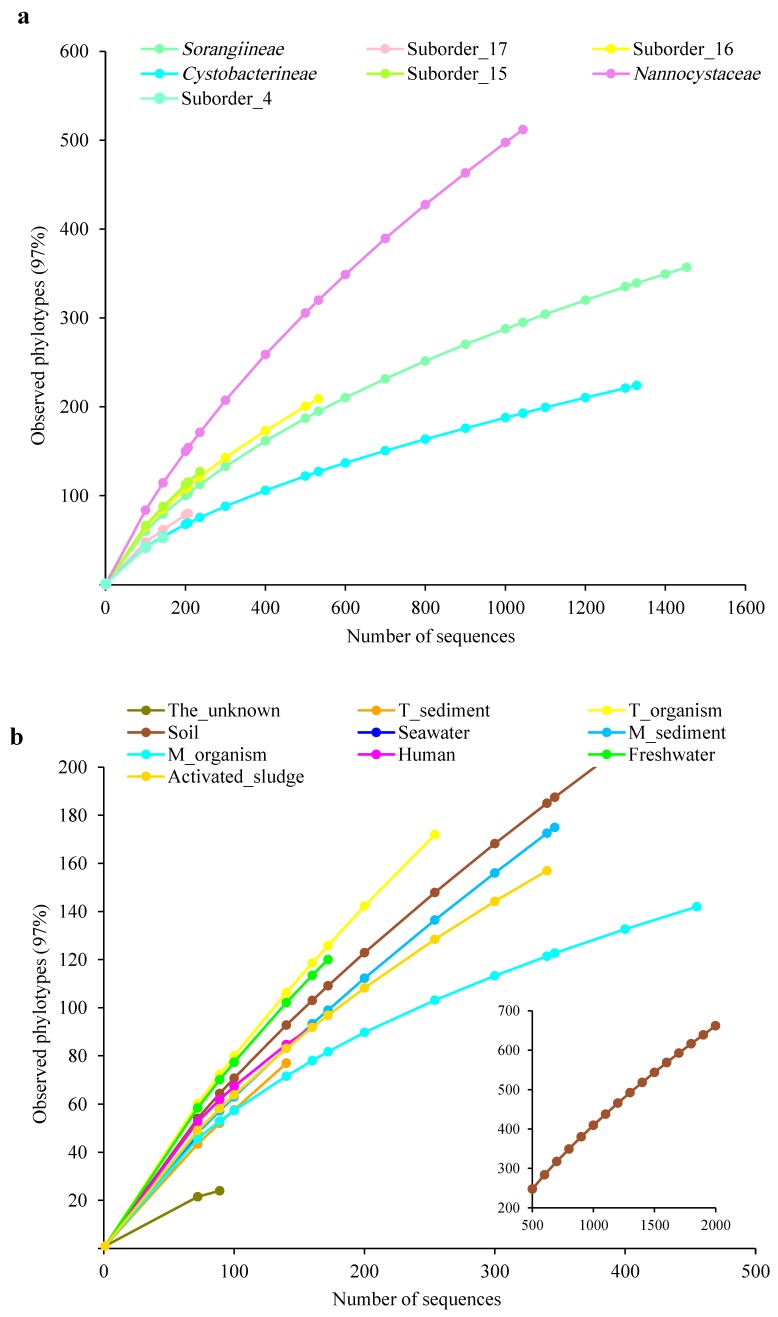
Figure 3.
Rarefaction curves for all 16S rRNA gene sequences based on the seven abundant suborders (a) and 10 environmental categories (b). Operational taxonomic unit s was determined at 97% identity. The colors of points and curves in the figure are listed in Table S2.

