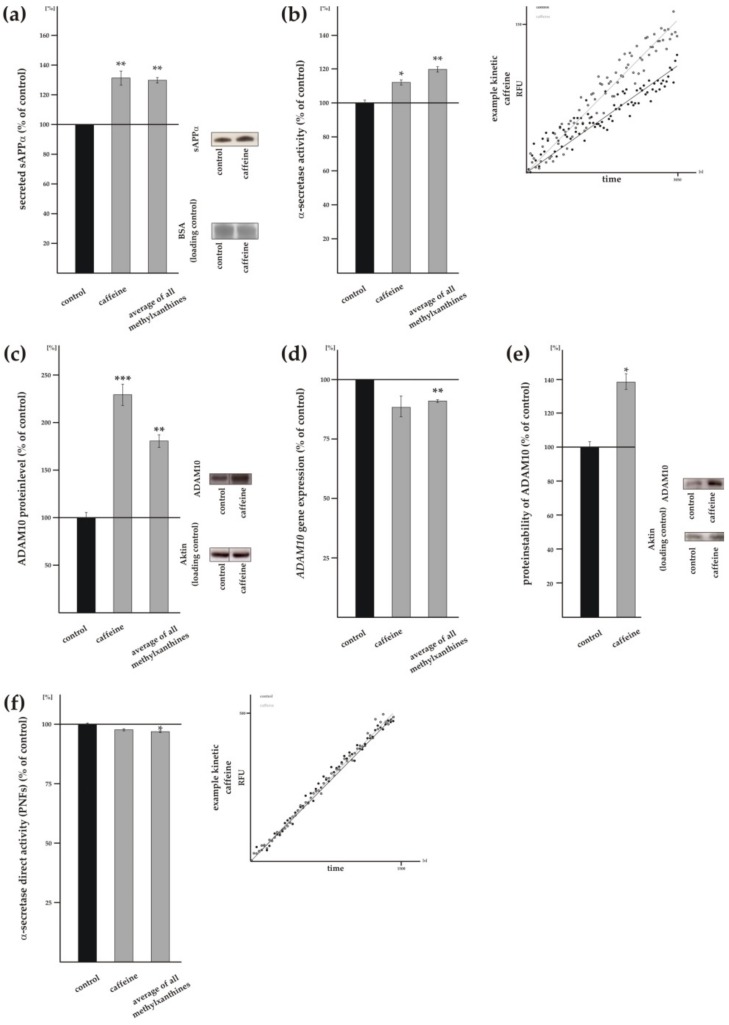
Figure 3.
Effects of caffeine and other MTXs on non-amyloidogenic APP processing. (a) Secreted soluble sAPPα of treated SH-SY5Y cells (n ≥ 9) and representative western blots (WBs) including load control. (b) Analysis of the α-secretase activity in living SH-SH5Y cells after treatment with MTXs (n ≥ 4). A representative kinetic of caffeine is shown in the right part of the figure. (c) Protein level of ADAM10 (n ≥ 4) and representative WBs including load control. (d) RT-PCR analysis of ADAM10 compared to control conditions (n ≥ 10). (e) Determination of ADAM10 degradation (n ≥ 4). Representative WBs including load control are shown on the right. (f) α-secretase activity in post nuclear fractions of incubated SH-SY5Y cells (n ≥ 4) and representative kinetic after treatment with caffeine. Error bars represent the standard error of the mean. Asterisks show the statistical significance calculated by unpaired Student’s t test (* p ≤ 0.05; ** p ≤ 0.01; *** p ≤ 0.001).

