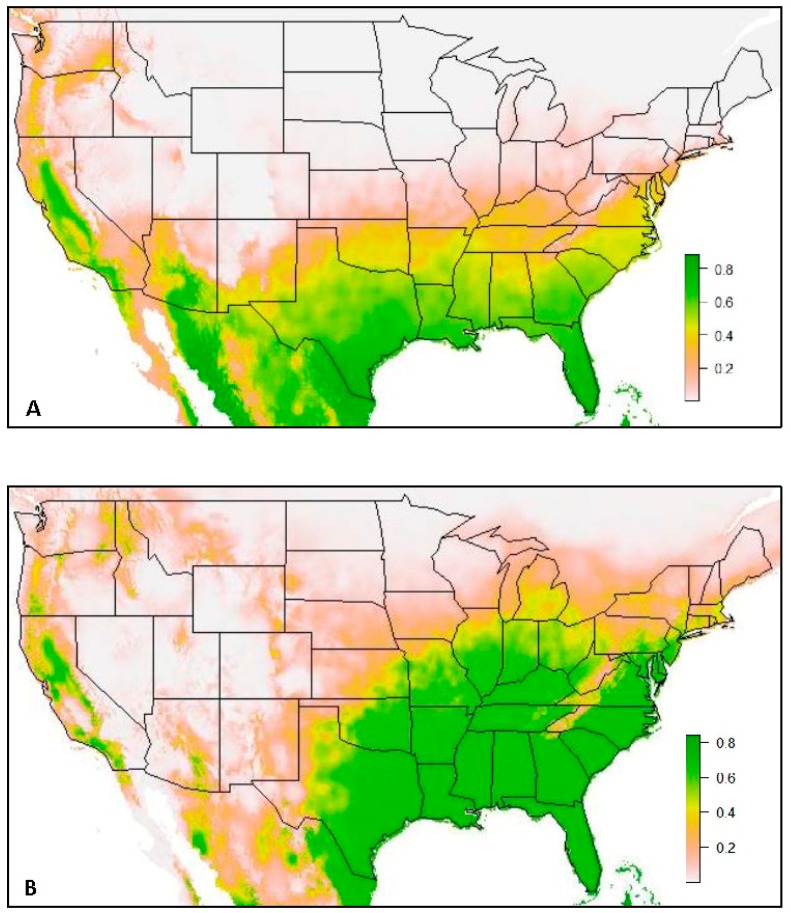
Figure 1.
(A) Model 1a: Species distribution model of Ae. aegypti, and (B) Model 1b: Species distribution model of Ae. albopictus, both using all occurrence records from 1960–2014 (Kraemer et al. 2015b database) and records obtained by VZL personnel in Texas during 2016 and 2017. Green coloration indicates areas of high predicted habitat suitability (suitability ≥ 0.6), with darker green indicating areas with highest habitat suitability (suitability ≥ 0.8), yellow coloration indicates moderate habitat suitability (suitability = 0.4–0.6), tan coloration indicates low habitat suitability (suitability = 0.2–0.4) and white to light tan coloration indicates extremely low habitat suitability (suitability = 0.0–0.2).

