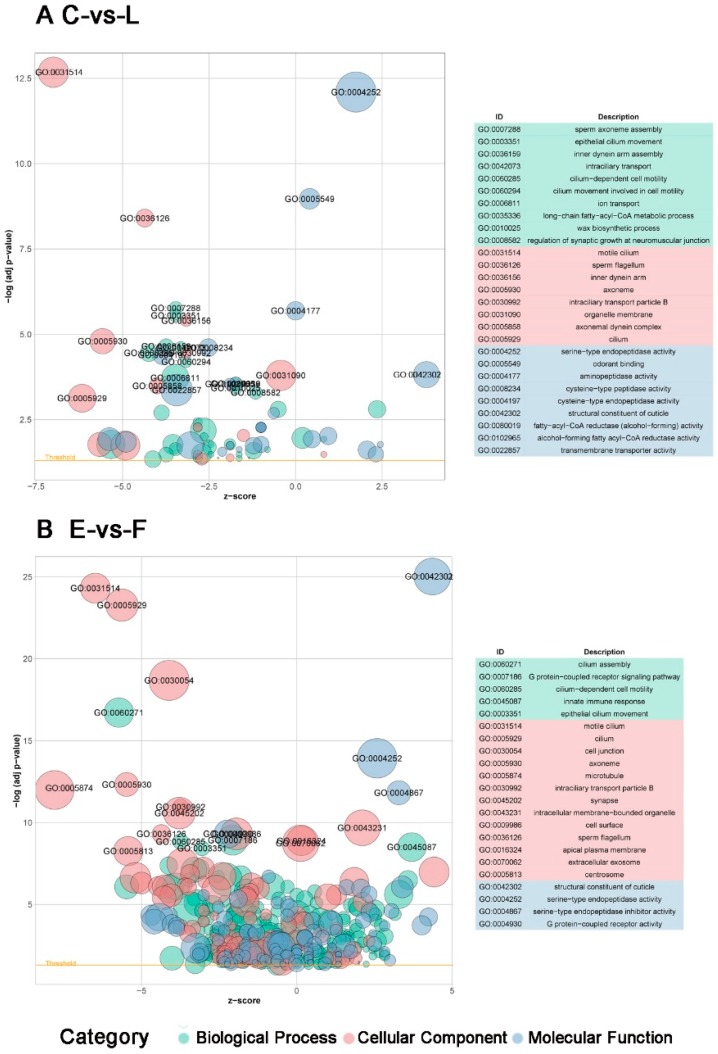
Figure 6.
Gene Ontology (GO) enrichment terms of DEGs in C-vs-L group (A) and E-vs-F group (B). GO terms grouped into three main categories: biological process, cellular component and molecular function. The X-axis means Z-score, that illustrates whether a GO term of experiment group is likely increased (positive values) or decreased (negative values) compared with the control group. The size of circle shows the number of genes involved in each GO term and colours represent variant categories. The yellow line demarcates the significance level of adjusted p-value (0.05).

