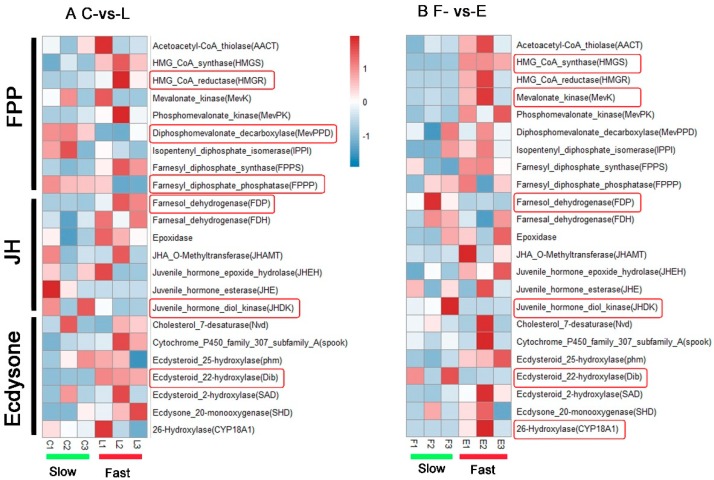
Figure 8.
Heatmap of normalized gene expression (fragments per kilobase of transcript per million mapped reads (FPKM) value) in juvenile hormone (JH) and moulting hormone (ecdysone) pathways in C-vs-L group (A) and E-vs-F group (B). Red indicates high expression and blue signifies low expression. The significant differentially expressed genes evaluated by DESeq2 were circled out by rounded rectangles.

