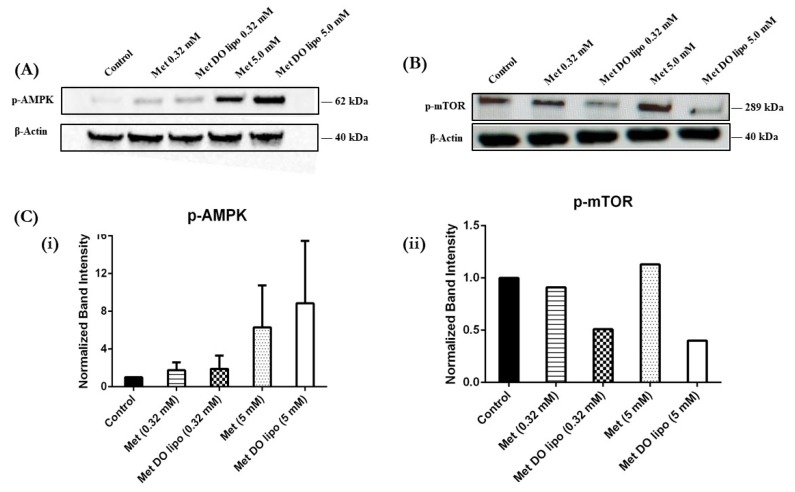
Figure 9.
Effect of treatment on cellular markers representing anti-tumor activity. (A) Representative Western blots to understand the effect of treatments on p-AMPK activity after 24 h of treatment at varied concentration. (B) Representative Western blots to understand the effect of treatments on p-mTOR activity after 24 h of treatment at varied concentration. (C) Representative quantified analysis of p-AMPK and p-mTOR (normalized) band intensity determined using ImageJ. As can be seen, Met DO lipo displays increased activation of p-AMPK (increased band intensity) and inhibition of p-mTOR (diminished band intensity) as compared to Met. The effect was seen to be concentration dependent. Representative images from n = 1 (for p-mTOR) to two (for p-AMPK) experiments.

