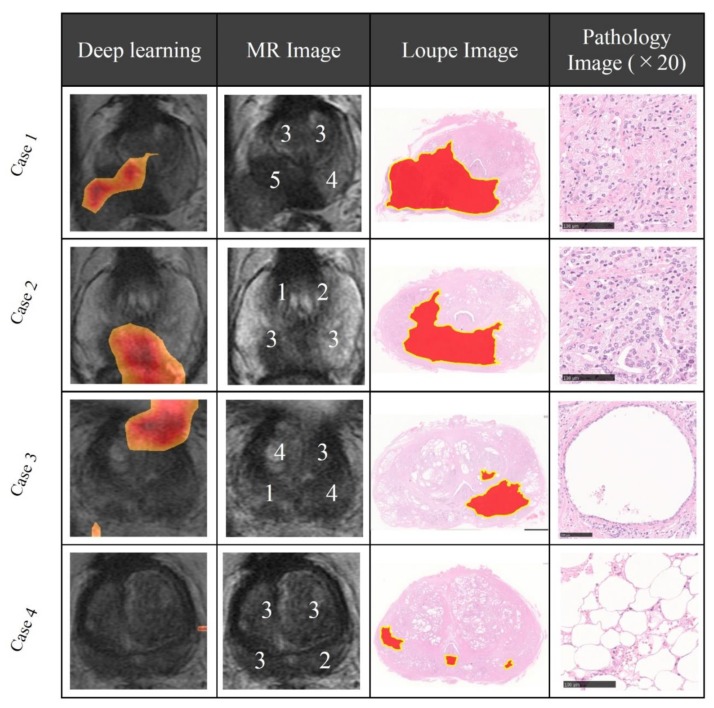
Figure 4.
Representative cases of deep learning-focused regions and expert-identified cancers. Left: Deep learning focused regions. Second left: MR image with PI-RADS score. Second right: Loupe image of pathology slides (red area indicates cancer locations). Right: Representative pathological image in the deep learning-focused region (×20). Details of each cases are shown in Supplementary Table S1. MR image = Magnetic resonance image, PI-RADS = Prostate imaging reporting and data system.

