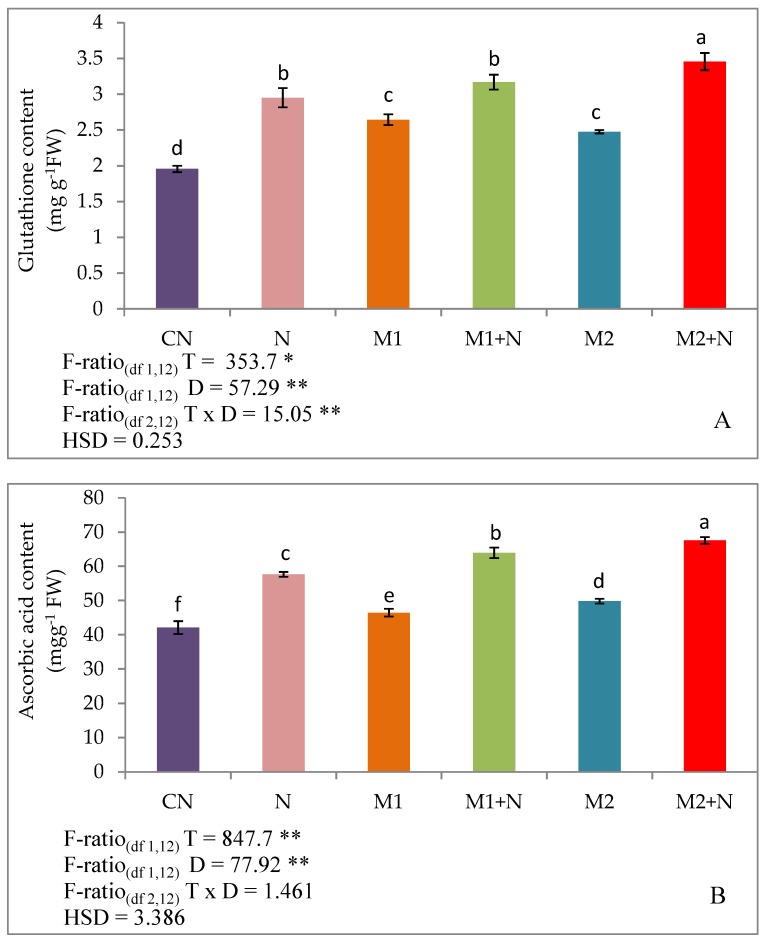
Figure 3.
Effect of M1 (109 cells/ ml) and M2 (109 cells/ ml) on: (A) Glutathione content, (B) Ascorbic acid content and (C) Tocopherol content in 45-days old L. esculentum plants under PPN infection. Data is presented as means of three replicates ± SD and HSD values. F ratio values, * indicates significance at p ≤ 0.05 and ** indicates significance at p ≤ 0.01). Different letters on the graphs indicate that mean values of treatments are significantly different at p< 0.5 according to Tukey’s multiple comparison test.


