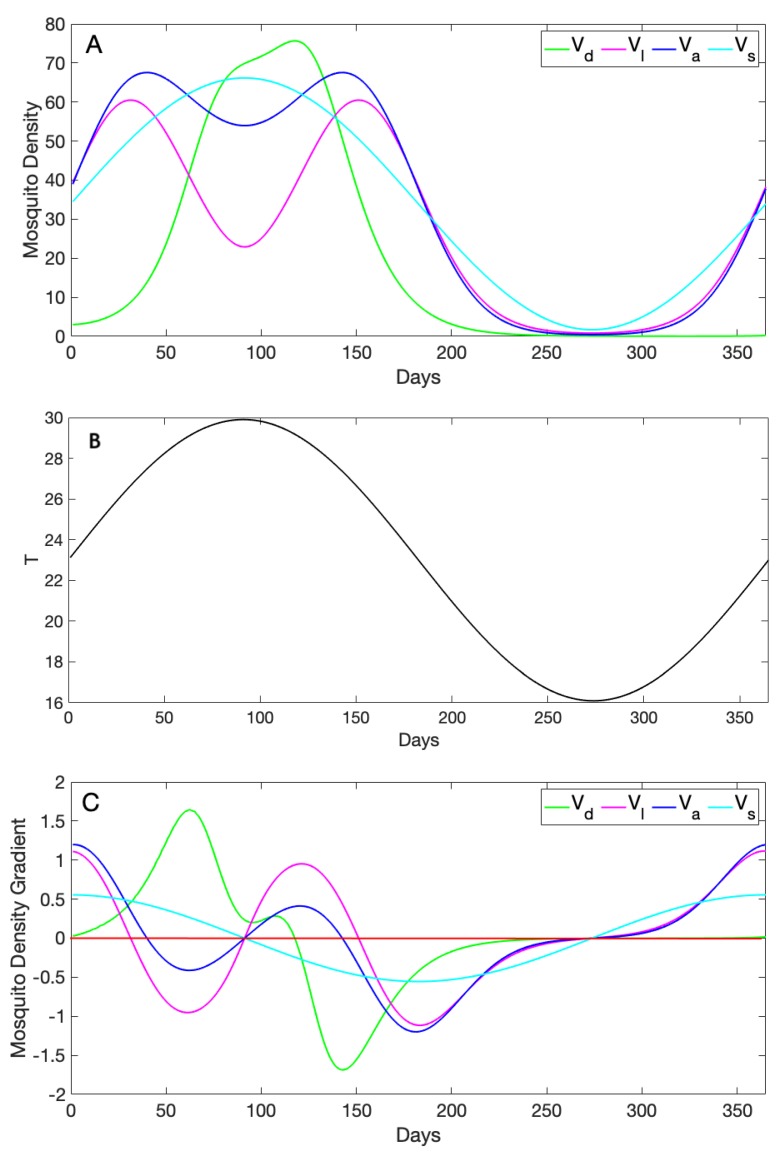
Figure 4.
(A) Daily adult female mosquito densities approximated using four forms, namely the sine wave with initial and amplitude of , the adult trait-dependent form , the life stage trait-dependent , and the dynamical density ; the parameter values used to solve the ode model are given in Table 1. (B) Daily temperature given by a sine function ( with and ) evaluated for 365 days used to evaluate our thermal traits incorporated into the dynamical model. (C) Densities’ first derivatives calculated to show how each curve changes its gradient as it varies with temperature. The red line shows when the gradient is zero; positive gradient values (above the red line) mean that the density increases; and negative values of the gradient (below the red line) mean that the curve decreases.

